Portfolio Performance Dashboard: Stop Misreading Real Estate Returns

A portfolio performance dashboard pulls your holdings, returns, and risk data into one view so you can judge performance without digging through statements. Professional dashboards report time-weighted returns for comparing manager skill against a benchmark, alongside money-weighted returns that reflect your actual dollar experience. The sections below walk through the metrics, measurement rules, and setup steps that make those numbers trustworthy.
TL;DR:
- Use time weighted returns to compare managers, but choose money weighted returns for personal cash flow results and illiquid strategies such as private equity.
- For comparable returns, keep fee treatment consistent, value portfolios on dates with large external cash flows, and geometrically link subperiod returns; GIPS requires monthly reporting.
- Read alpha alongside tracking error: modest alpha with low tracking error can indicate steadier skill than higher alpha accompanied by wider swings.
- Use attribution to separate sector allocation from security selection, and check fund overlap after each new purchase because simple position counts can hide concentrated exposure.
- For property holdings, track cap rate, cash on cash return, occupancy, vacancy, and maintenance reserves, since headline returns can conceal repair costs or lost rent.
Table of Contents
- What Professional Portfolio Dashboards Show
- Key Performance and Risk Metrics to Read Correctly
- Measurement Rules That Keep Numbers Comparable
- Advanced Analytics: Attribution, Stress Testing, and Concentration
- How to Choose and Set Up a Dashboard: A Checklist
- Applying the Real Estate Investor Toolkit to Portfolio and Deal Monitoring
- Real Estate Metrics That Belong on an Investment Dashboard
- Handling Different Asset Classes and Property Types
- Alerts and Notifications for Performance and Risk Thresholds
- Consistent Measurement Matters More Than Any Single Number
- Try Real Estate Investor Toolkit: Free Calculators and Paid Reports
- FAQ
- Sources
What Professional Portfolio Dashboards Show
A well-built dashboard organizes information so you can move from a high-level snapshot to the details behind any number in a few clicks. The holdings and allocation widget is usually the starting point, letting you drill down by account, sector, or geographic region to see where your money actually sits.
From there, most dashboards pair a performance chart against a chosen benchmark with a period returns table, so you can compare your results across weeks, quarters, or years at a glance. Vendor platforms such as Interactive Brokers’ PortfolioAnalyst let you toggle between time-weighted and money-weighted figures and switch across multiple time frames in the same view.
Beyond the core chart, expect these standard widgets, including a projected income widget estimating dividends and interest you can expect going forward:
- Holdings movers, showing which positions drove gains or losses in the period.
- Projected income, estimating dividends and interest you can expect going forward.
- Cash-flow and NAV tracking, separating deposits and withdrawals from actual investment performance.
- Exportable reports, formatted for sharing with a co-investor or advisor.
Reporting frequency matters as much as the widgets themselves. Look for flexible ranges covering short-term and year-to-date views, plus the option to set custom start and end dates, with frequent summaries depending on how closely you track the portfolio.
Key Performance and Risk Metrics to Read Correctly
The numbers on a dashboard only help you if you know what each one is actually telling you. A few definitions make the rest of this article, and your dashboard, much easier to use:
- Time-weighted return (TWR): measures the return of the portfolio itself, stripping out the effect of when you added or withdrew cash. Use it to judge manager or strategy performance.
- Money-weighted return (MWR/IRR): reflects your personal dollar experience, including the timing and size of your contributions and withdrawals.
- Alpha: the excess return generated relative to a benchmark, after adjusting for market exposure.
- Beta: how sensitive your portfolio is to market movements; a beta above 1 means more volatility than the benchmark.
- Sharpe ratio: return earned per unit of total risk (volatility).
- Sortino ratio: similar to Sharpe, but it only penalizes downside volatility, which many investors find more intuitive.
- Max drawdown: the largest peak-to-trough decline, useful for understanding worst-case pain.
- Tracking error: how far your portfolio’s returns stray from its benchmark over time.
Alpha rarely stands alone. PIMCO’s analysis of risk-adjusted performance notes that alpha must be read together with tracking error: a modest alpha paired with low tracking error can represent more consistent skill than a larger alpha achieved with wide, unpredictable swings.
Match the metric to the decision. Use TWR when comparing a manager against peers, MWR when you want to know how your actual cash flows performed, and drawdown or Sortino when you’re setting risk limits rather than chasing returns. Confirm whether figures are shown net or gross of fees, and whether income like dividends and interest is included. These choices change the number significantly, even when the underlying holdings are identical.
Measurement Rules That Keep Numbers Comparable
Numbers on a dashboard are only useful if they’re calculated consistently, which is where industry standards come in. The GIPS Guidance Statement on Calculation Methodology requires time-weighted rates of return specifically because they remove the distortion caused by external cash flows, making it possible to compare one portfolio or manager against another on equal footing. Private equity and other illiquid strategies are a recognized exception, where money-weighted methods are generally more appropriate given the nature of capital calls and distributions.
The same guidance specifies how to handle the mechanics behind the number: portfolios should be valued on dates with large external cash flows rather than only at month-end, and returns from each sub-period need to be geometrically linked rather than simply averaged. Minimum reporting frequency under GIPS is monthly, though many dashboards offer daily updates for convenience between formal reporting periods.
Fees deserve the same consistency. Decide upfront whether you’re reviewing gross-of-fee or net-of-fee returns, and keep that choice constant across every report you generate. Switching between the two from one period to the next is one of the fastest ways to make a track record look better or worse than it actually is.
Advanced Analytics: Attribution, Stress Testing, and Concentration
Once the basic return and risk numbers are solid, a few advanced tools reveal where performance actually comes from and where risk might be hiding. CFA Institute’s guidance on portfolio performance evaluation treats measurement, attribution, and appraisal as distinct steps, with attribution doing the work of reconciling your returns back to specific decisions, such as which sectors you overweighted or which securities you picked within them.
Attribution typically splits into two components:
- Allocation effect: the impact of overweighting or underweighting a sector or asset class relative to the benchmark.
- Selection effect: the impact of which specific securities you chose within each sector.
Stress testing adds a forward-looking layer. Historical-replay tests show how your current holdings would have performed during a past event, like a rate shock or a market crash, while hypothetical scenario tests model shocks that haven’t happened yet, which matters more when market conditions are shifting into territory the historical record doesn’t cover.
Concentration analysis is the piece investors most often skip. CFA Institute’s overview of the GIPS standards points to ETF overlap analysis and the Herfindahl-Hirschman Index, or effective number of holdings, as better tools than a simple position count, since several funds can quietly stack exposure to the same handful of stocks.
Pro Tip: Run a concentration check whenever you add a new fund, not just at year-end, since overlap tends to build up gradually and unnoticed.
How to Choose and Set Up a Dashboard: A Checklist
Setting up a dashboard well takes about twenty minutes and saves hours of confusion later. Work through these steps in order:
- Define your purpose and benchmark before touching any settings, since a growth-focused mandate and an income-focused one need different comparison points.
- Pick your measurement convention: time-weighted for evaluating manager or strategy skill, money-weighted for tracking your personal dollar results.
- Set your reporting cadence, choosing daily, monthly, or quarterly updates based on how actively you manage the portfolio.
- Confirm the valuation policy, including how large cash flows are handled and whether fees are shown gross or net.
- Check data sources and permissions, making sure account linking is secure and read-only access is used wherever possible.
- Turn on attribution and alerts so you’re notified of meaningful shifts rather than having to check manually.
- Schedule a recurring review, monthly or quarterly, so numbers get interpreted instead of just generated.
Applying the Real Estate Investor Toolkit to Portfolio and Deal Monitoring
For real estate holdings specifically, we built a set of calculators that cover the same ground a dashboard tracks for stocks and bonds, applied to rental properties and flips. Our free tools, available with no sign-up, include an ARV calculator, a rental cash flow analyzer, and tools for estimating rehab costs before you commit to a deal.
When you need to project income across a rental portfolio, tools help you work out projected cash flow and cap rate for each property, then compare that against your maximum allowable offer before you buy. For investors managing multiple deals at once, deal tracking can consolidate deal-level returns into a single pipeline view, and paid reports may add the depth needed for investor-ready documentation.
Real Estate Metrics That Belong on an Investment Dashboard
Standard portfolio metrics like Sharpe ratio and alpha were built for securities, so they don’t translate cleanly to a rental property. Real estate needs its own set of numbers, and a dashboard covering property holdings should track them alongside, not instead of, the standard figures.
Cap rate shows a property’s net operating income as a percentage of its value, making it useful for comparing properties of different sizes or price points. Cash-on-cash return measures annual pre-tax cash flow against the actual cash invested, which matters more to most buy-and-hold investors since it reflects the return on money actually out of pocket rather than on the full purchase price. Occupancy rate tracks the percentage of time a unit generates rent, directly affecting both of the return figures above. Our guide to analyzing a rental property walks through how these three numbers interact in practice, including the role of the 1% rule as a quick screening tool before a deeper analysis.

A property-focused dashboard should also flag vacancy trends and maintenance reserve balances, since a strong cap rate on paper can mask a property that’s quietly eating its own cash flow in repairs. Tracking capital expenditure reserves alongside monthly cash flow gives a more honest picture of a property’s real contribution to your portfolio than a single return figure in isolation.
Handling Different Asset Classes and Property Types
A portfolio rarely sits in one asset class, and a dashboard needs to treat each type on its own terms rather than forcing everything into one return calculation. Single-family rentals, multifamily buildings, and commercial space each carry different income patterns, vacancy risk, and financing structures, so grouping them separately preserves the detail that a blended average would hide.

Within real estate alone, a BRRRR property behaves differently on a dashboard than a straightforward buy-and-hold rental, since the refinance step changes the cash invested partway through the hold period and can distort a simple return calculation if it isn’t accounted for separately. Our BRRRR calculator handles that refinance step directly, which keeps the resulting return comparable to your other holdings instead of skewed by a one-time cash-out event.
For a mixed portfolio spanning stocks, bonds, and property, the practical approach is to maintain asset-class-level views that roll up into a single net worth or total return figure at the top, while keeping each class’s own relevant metrics, Sharpe ratio for securities, cap rate for property, visible underneath. That structure lets you judge each holding by the standard that actually applies to it.
Alerts and Notifications for Performance and Risk Thresholds
Checking a dashboard manually every day isn’t realistic for most investors, which is where alerts earn their place. A well-configured dashboard notifies you when a position moves beyond a set threshold, when drawdown crosses a level you’ve defined as uncomfortable, or when a benchmark comparison shifts meaningfully over a reporting period.
Useful alert categories include price or value thresholds on individual holdings, portfolio-level drawdown limits, and changes in risk metrics like beta or volatility that signal your overall exposure has shifted without any trades on your part. For rental property, alerts tied to vacancy, late rent, or maintenance reserve balances falling below a set minimum serve the same purpose: catching a problem before it shows up as a disappointing quarterly return.
The goal is to be notified of what matters and ignore the rest. Too many alerts trains you to dismiss them; too few means a real problem goes unnoticed until the next scheduled review. Setting thresholds around your actual risk tolerance, rather than default settings, keeps the notifications relevant to decisions you’d actually act on.
Consistent Measurement Matters More Than Any Single Number
The biggest mistake we see isn’t picking the wrong metric, it’s switching conventions between reporting periods and losing the ability to compare one quarter to the next. Pick time-weighted or money-weighted returns, pick gross or net of fees, and hold that choice steady. Resist reading too much into any single short-term number. Attribution and fee-adjusted reporting tell you more about whether a strategy is working than a headline return ever will.
— Michael
Try Real Estate Investor Toolkit: Free Calculators and Paid Reports
Putting the checklist above into practice is easier with tools built specifically for property investors. Free calculators let you check ARV, rehab costs, and rental cash flow in minutes, with no sign-up required, so you can test a deal before committing to anything.
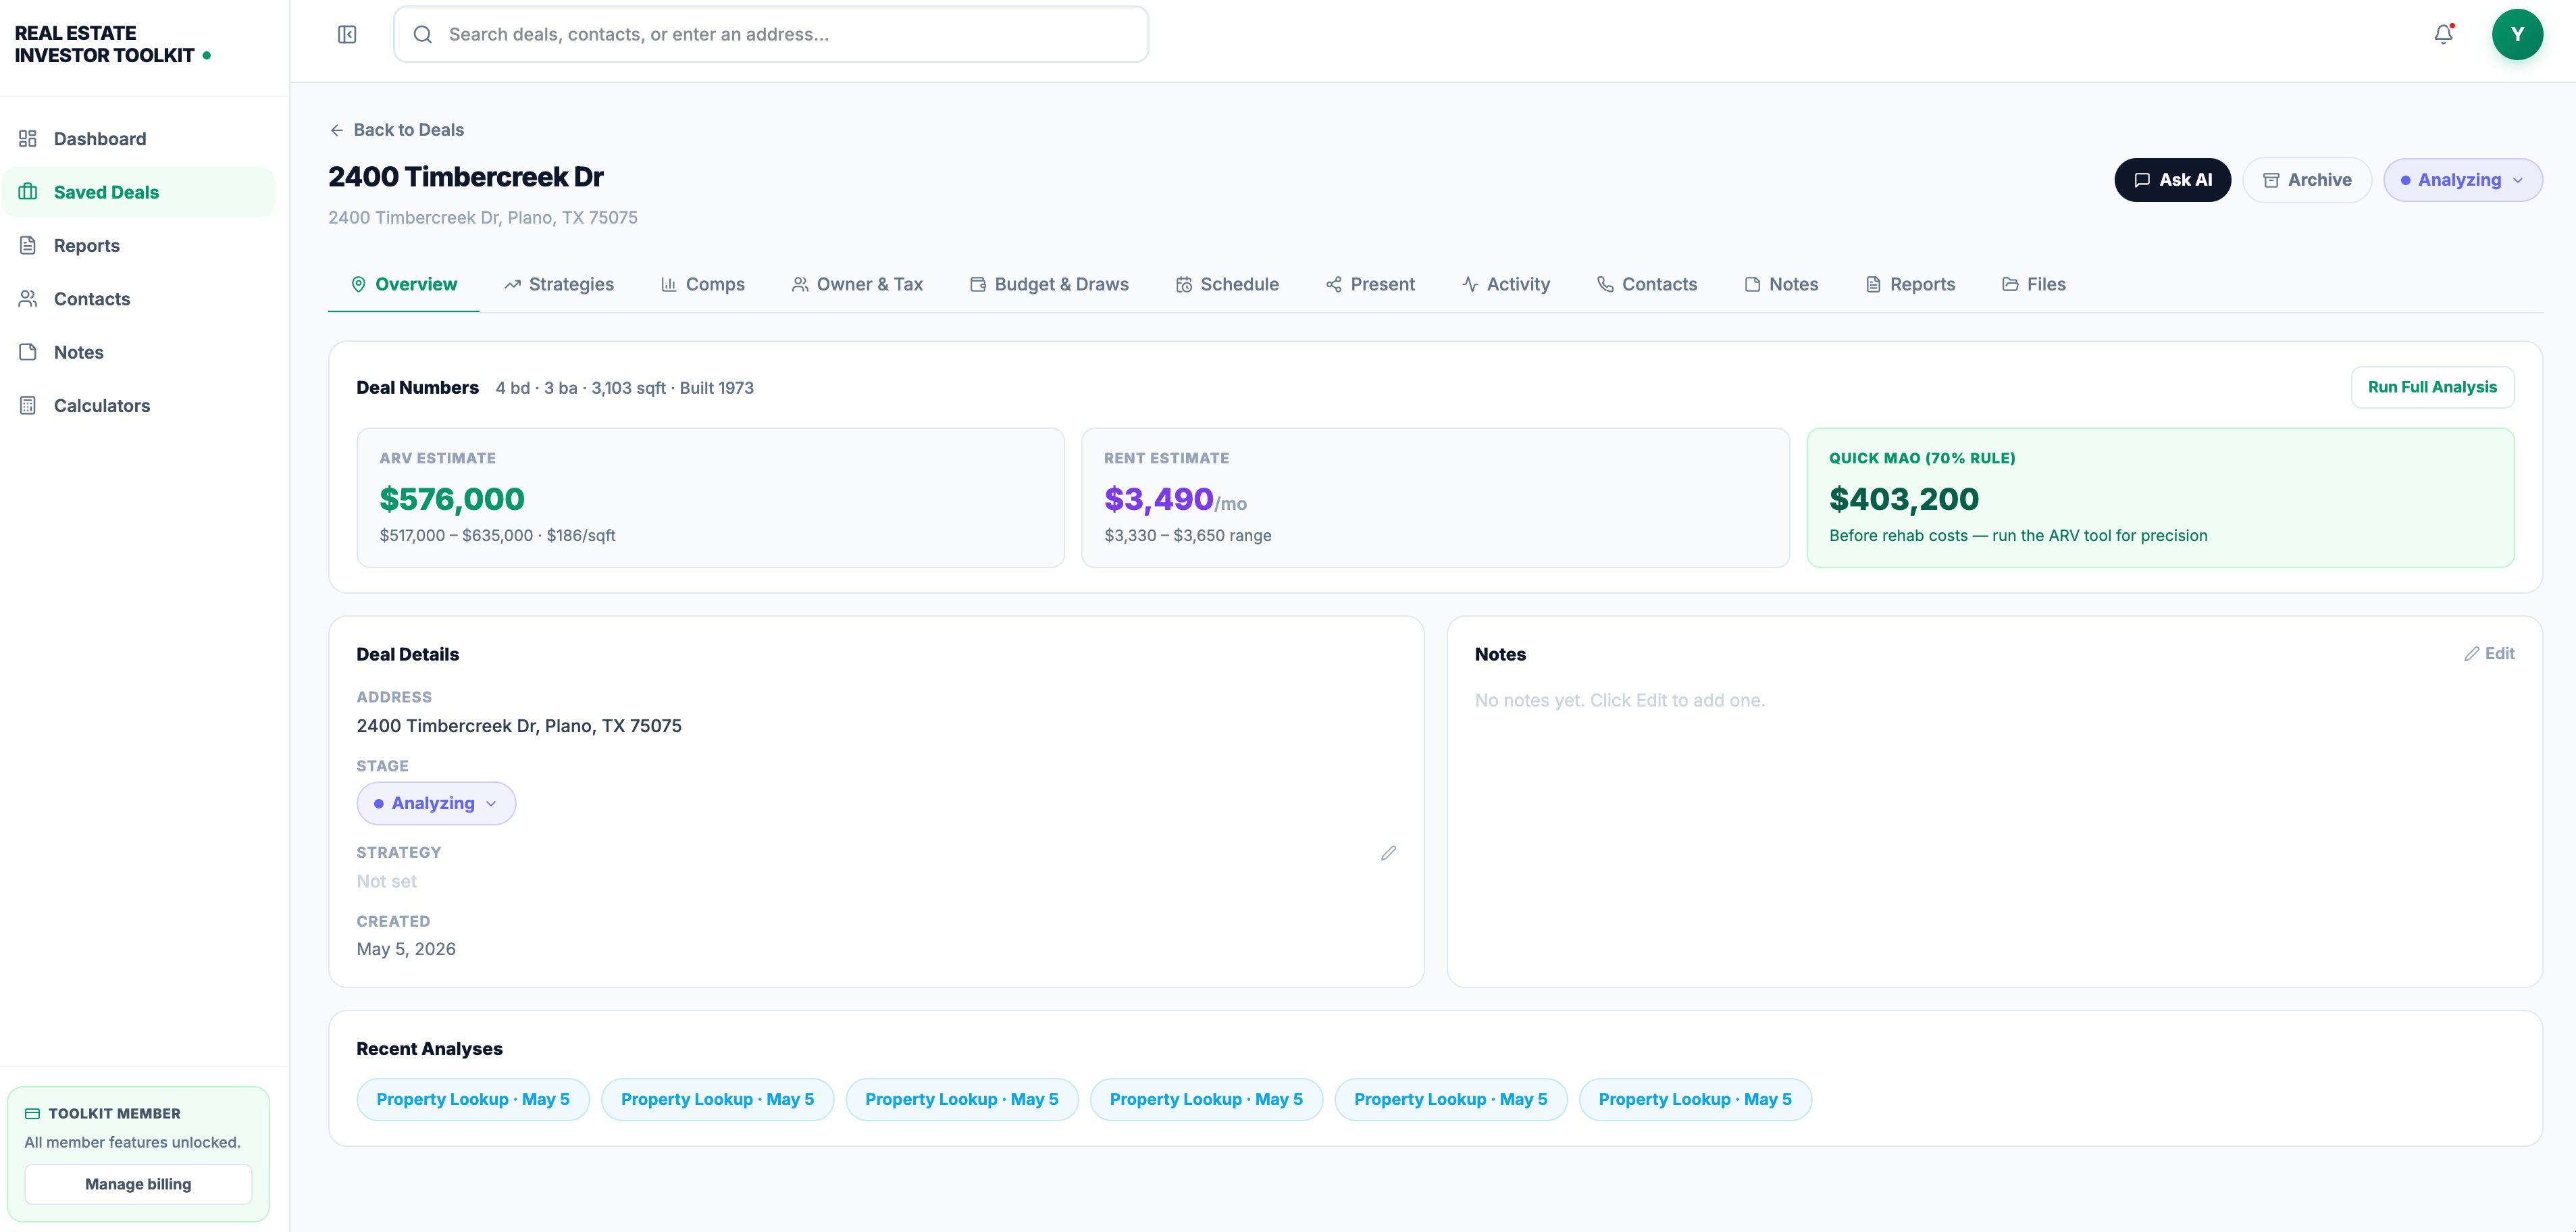
When you’re ready to move from one-off checks to ongoing portfolio tracking, our Real Estate Investor Toolkit plan at $39.99 per month adds unlimited reports, DealFlow pipeline tracking, and consolidated views across every property you hold. Start with the free tools and upgrade when you need the full picture.
This article is general information, not a substitute for advice from a qualified financial advisor. Consult a qualified financial professional about your own circumstances before acting on anything here.
FAQ
How do you track portfolio performance?
You track portfolio performance by consolidating holdings and transactions into a dashboard that calculates time-weighted returns for comparing strategy performance and money-weighted returns for your actual dollar experience. Most investors review these figures monthly or quarterly, alongside risk metrics like drawdown and volatility, to catch issues before they compound.
What is a good dashboard for performance management?
A good dashboard shows holdings and allocation, a performance chart against a benchmark, both time-weighted and money-weighted returns, and risk metrics like Sharpe ratio and max drawdown. It should also support attribution analysis and customizable alerts so you’re notified of meaningful changes rather than checking manually every day.
Is portfolio visualizer good?
Portfolio analysis tools vary widely in depth, and the right choice depends on whether you’re tracking securities, real estate, or a mix of both. For property-specific metrics like cap rate and cash-on-cash return, a rental property calculator designed for real estate gives more relevant output than a general securities-focused tool.
How do I see my portfolio?
Most brokerage platforms and dedicated dashboard tools let you view your portfolio by linking accounts directly, pulling in positions and transactions automatically. For real estate holdings, which rarely sync through a data feed, tracking rental income, cap rate, and occupancy separately and rolling those figures into your main portfolio view monthly keeps the overall picture current.
Sources
A dashboard is only as good as the data feeding it, which is why aggregation matters as much as the display layer. Most platforms connect to brokerage accounts, bank feeds, and custodians through secure data links, pulling positions and transactions automatically rather than requiring manual entry for every trade or deposit.
For mixed portfolios that combine securities with real estate, aggregation gets more manual by necessity. Property values, rental income, and loan balances rarely sync automatically the way brokerage data does, so many investors maintain a separate property-level view and import summary figures into their main dashboard periodically, monthly or quarterly depending on how often loan balances and valuations change.
When evaluating a dashboard’s integration options, check three things: how it handles accounts held at multiple institutions, whether it supports manual entry for assets that don’t have a direct data feed, and how it reconciles timing differences between when a transaction happens and when it’s reported. A dashboard that aggregates cleanly across both liquid and illiquid holdings gives you a single source of truth instead of several partial pictures that need to be reconciled by hand every time you want an accurate net worth figure.