Calculator First Rental Cash Flow: Component CapEx Reserves for Investors

Rental cash flow is the money left in your pocket each month after collecting rent and paying every expense and mortgage bill. The formula is straightforward: cash flow = market rent − vacancy − operating expenses − debt service. Run any property through this equation before you run it through anything else. If the number is positive after realistic inputs, move to a full pro forma; if it’s negative, walk away or renegotiate.
TL;DR:
- Using a conservative vacancy rate of 5% to 8% and actual tax and insurance bills ensures realistic cash flow estimates.
- Budget for operating expenses as a percentage of gross rent, with detailed line-item estimates and component-based CapEx reserves for accuracy.
- Small variations in mortgage rate or down payment can significantly impact monthly cash flow and overall investment returns.
- Running multiple scenarios with different rent, vacancy, and financing assumptions helps identify the deal’s sensitivity to key variables.
- Confirm rent and expense inputs with signed leases, comps, and current bills to avoid overestimating potential cash flow.
Table of Contents
- How Do You Calculate Rental Cash Flow Analysis Fast?
- Calculating NOI, Debt Service, and Cash-on-Cash Return
- What Expenses Should You Budget for a Rental Property?
- How Sensitive Is Cash Flow to Rate and Down Payment Changes?
- Using a Rental Calculator or Pro Forma Template the Right Way
- How Do You Forecast Rental Cash Flow Years Into the Future?
- How Do Depreciation and Amortization Affect Your Cash Flow?
- What Experienced Investors Actually Check Before Buying
- Run Your Numbers With Real Estate Investor Toolkit’s Calculators
- Sources
- FAQ
How Do You Calculate Rental Cash Flow Analysis Fast?
Before you build a full pro forma, you need a short list of real numbers. Guessing at rent or skipping reserves is where most cash-flow projections go wrong, since overstated rent and undercounted cash-to-close are the most common underwriting errors.
Gather these inputs first:
- A signed lease, or at minimum three comparable rentals within a mile.
- Any other income (parking, laundry, storage fees).
- A realistic vacancy rate, usually 5% to 8% depending on the market.
- Property tax, insurance, and HOA dues, pulled from actual bills, not estimates.
- Property management fee, typically 8% to 10% of collected rent if you’re not self-managing.
- Routine maintenance budget and a separate CapEx reserve.
- Utilities you’ll pay directly, if any.
- Loan terms: down payment, interest rate, term, and any points.
- Closing costs and prepaid escrow items.
Once you have those, the waterfall runs in one direction: gross scheduled rent, minus vacancy, minus operating expenses, equals net operating income. Subtract debt service and you have cash flow. Quick screens like the 1% rule (monthly rent should be roughly 1% of purchase price) and the 50% rule (expenses eat about half of gross rent) work as fast filters, but both heuristics are screening tools, not underwriting — they miss local tax rates, HOA fees, and property-specific repair history.
Calculating NOI, Debt Service, and Cash-on-Cash Return
Net operating income is the foundation metric, and it has one clean definition: NOI = effective gross income − operating expenses. Effective gross income is market rent minus vacancy loss, plus any other income like laundry or parking fees. NOI excludes debt service entirely — that’s what separates it from cash flow.
Annualize every monthly input before you calculate, and make sure your operating expense list is complete:
- Property taxes and insurance (annual totals, not monthly escrow guesses)
- HOA dues, if applicable
- Property management fees
- Routine maintenance and repairs
- CapEx reserve contribution
- Utilities paid by the owner
- Landscaping, pest control, or other recurring service contracts
Debt service is your principal and interest payment, calculated from the loan amount (purchase price minus down payment), interest rate, and amortization term. A mortgage calculator handles the math, but the inputs matter more than the tool.
From there:
- Monthly cash flow = (Annual NOI − Annual debt service) ÷ 12
- Cap rate = NOI ÷ Purchase price
- Cash-on-cash return = Annual cash flow ÷ Total cash invested (down payment plus closing costs and initial reserves)
Cap rate ignores financing entirely, which makes it useful for comparing properties across markets. Cash-on-cash and ROI account for the capital you actually put in and how debt changes your return, which makes it the better number when you’re deciding whether to write the offer. One warning worth repeating: if your lender escrows taxes and insurance into the mortgage payment, don’t list those as separate operating expenses and then again inside the loan payment. That double-counts them and understates your real cash flow.
What Expenses Should You Budget for a Rental Property?
Operating expenses typically run 35% to 55% of gross rent, depending on property age, whether the tenant covers utilities, and how much deferred maintenance you inherit. That range is wide enough to swing a marginal deal from profitable to money-losing, so line-item estimates beat blanket percentages every time.
Break expenses into categories instead of guessing at a lump sum:
- Property tax and insurance, pulled from the county assessor and an actual quote
- HOA dues, verified against the HOA’s current budget, not last year’s number
- Management fee, usually a percentage of collected rent
- Routine maintenance, often 5% to 10% of rent for older properties
- Turnover and leasing costs, including cleaning, minor repairs, and any leasing commission
CapEx reserves deserve their own line, calculated component by component rather than as a flat percentage. The math: replacement cost ÷ remaining useful life ÷ 12 gives you a monthly reserve figure. A roof that costs $9,000 to replace and has 15 years of remaining life needs $50 a month set aside. Add up the roof, HVAC, water heater, and flooring, and you’ll usually land on a number very different from “save 5% of rent.”
Component-based reserves catch problems that percentage-of-rent estimates miss, particularly on older properties where several big-ticket items are approaching the end of their life at the same time. If you’re budgeting for exterior surfaces like a parking lot or driveway, pavement maintenance guidance can help you scope replacement costs realistically instead of guessing.

Cash needed at closing runs higher than most first-time buyers expect. Once you add lender fees, prepaid insurance, escrow deposits, and initial reserves, total cash-to-close often lands 20% to 25% above the down payment alone.
How Sensitive Is Cash Flow to Rate and Down Payment Changes?
A single deal can look great or terrible depending on which assumptions you plug in, which is exactly why you model more than one scenario before committing.
Try three versions of the same property:
- Conservative: rent at the low end of your comps, 8% vacancy, higher maintenance reserve, current market rate
- Baseline: rent at your best comp-supported estimate, 5% vacancy, standard reserve, current rate
- Optimistic: rent slightly above asking with strong comps, 3% vacancy, lower reserve, a slightly better negotiated rate
A 0.5% to 1.0% swing in your mortgage rate can shift monthly cash flow by a meaningful margin on a typical loan, enough to flip a marginal deal from profitable to break-even. Larger down payments cut your loan amount and monthly debt service, which raises cash flow but lowers your cash-on-cash return since you’ve tied up more capital.
Watch for the leverage tipping point: when your borrowing cost exceeds the property’s cap rate, debt drags your return down instead of amplifying it. Modeling the deal all-cash alongside the leveraged version shows you whether the property is fundamentally sound or only looks good because of favorable financing. Build a simple table with rent, vacancy, rate, and reserve as rows and monthly cash flow as the output column, then swap one variable at a time to see which one moves the number most.
Using a Rental Calculator or Pro Forma Template the Right Way
A calculator only produces a trustworthy answer if the inputs behind it are trustworthy. Work through them in order: confirm rent against a signed lease or comps within a mile, set vacancy realistically for the submarket, pull actual tax and insurance figures, add management and maintenance, then build your CapEx reserve component by component before entering loan terms.
Before you trust the output, run these sanity checks:
- Does the rent match a signed lease, or at least three solid comps?
- Have you confirmed HOA dues against the current budget, not an old statement?
- Are utilities correctly assigned to owner or tenant?
- Are escrowed items counted once, not twice?
A spreadsheet template that outputs NOI, cap rate, cash-on-cash, and cash flow side by side makes comparing properties far easier than rebuilding the math each time. A pro forma built around this same waterfall lets you swap assumptions without starting over.
Pro Tip: Save every scenario’s assumptions in a labeled table at the top of your underwriting file. Six months later, you’ll thank yourself for remembering exactly what vacancy rate and rent number you used to justify the offer.
How Do You Forecast Rental Cash Flow Years Into the Future?
Static one-year numbers only tell you whether a deal clears the bar today. Real returns compound or erode over a holding period, and two forces drive most of that change: rent growth and expense inflation.
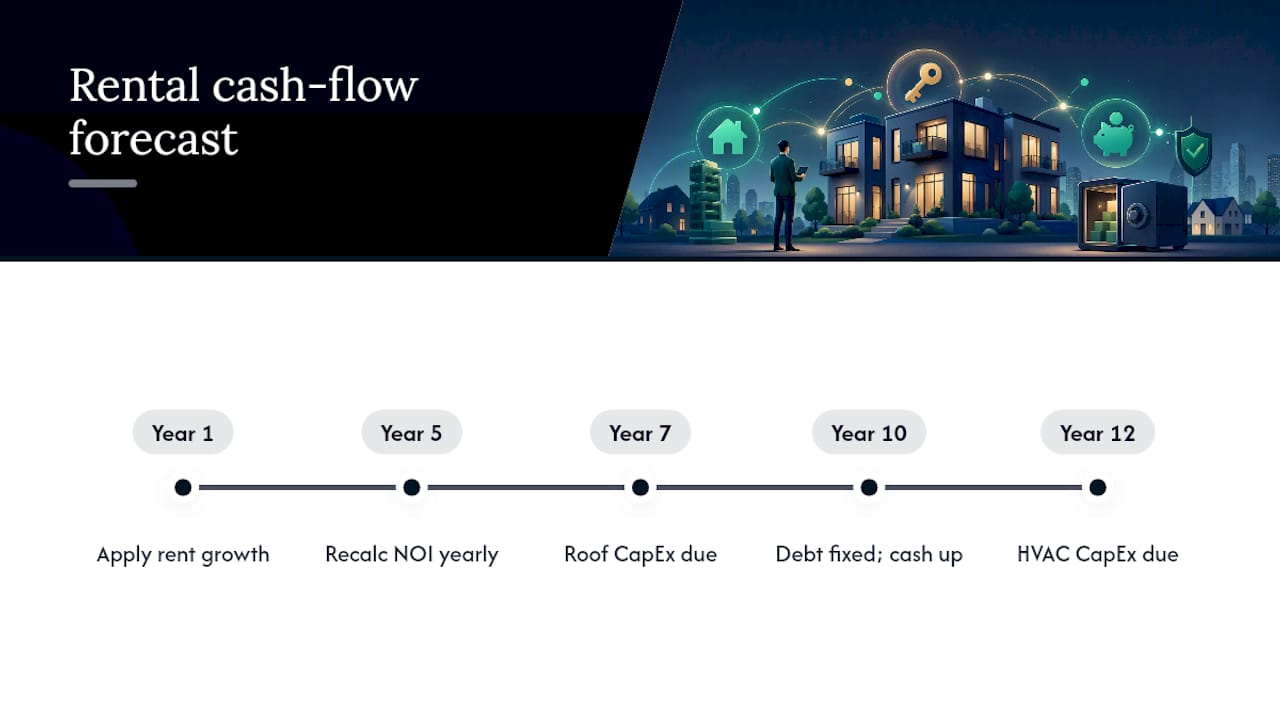
The standard approach applies a modest annual growth rate to rent, often in the 2% to 4% range depending on local market conditions, and a separate inflation rate to operating expenses, which frequently rises faster than rent in a given year. Project both forward five to ten years in a simple spreadsheet, recalculating NOI and cash flow annually. Because debt service stays fixed on a traditional fixed-rate mortgage, rising rent while the mortgage payment holds steady is what usually drives the biggest year-over-year cash flow improvement in a hold.
Don’t apply the same growth rate to every expense line. Property taxes can jump sharply after a sale due to reassessment, insurance premiums have climbed faster than general inflation in many regions, and maintenance costs tend to rise as a property ages rather than staying flat. Modeling all expenses at a single blended inflation number hides these differences and can make a five-year projection look far smoother than reality.
Build your forecast as a year-by-year table rather than a single multiplied number. Track rent, vacancy-adjusted income, each expense category, debt service, and resulting cash flow for each year of the hold. This also lets you identify the year a CapEx item is likely to hit (a roof at year seven, an HVAC system at year twelve) and reserve for it in advance rather than treating every year as identical to the first.
How Do Depreciation and Amortization Affect Your Cash Flow?
Depreciation and loan amortization don’t touch the cash in your bank account, but they change what you owe the IRS, which indirectly affects the cash flow you actually keep.
Depreciation lets you deduct a portion of the property’s value (excluding land) from taxable income every year, typically over 27.5 years for residential rental property under standard IRS rules. This deduction reduces your reported taxable income without costing you a dollar out of pocket, which is why a property can show positive cash flow while reporting a paper loss to the IRS. That paper loss can lower your tax bill, effectively increasing your after-tax cash flow even though the pre-tax number on your pro forma hasn’t changed.
Amortization works differently but gets confused with depreciation often. Your mortgage payment splits between interest (a deductible expense) and principal (which is not deductible but builds equity). Early in a loan, more of each payment goes to interest; later, more goes to principal. This shift doesn’t change your monthly cash flow at all, since the total payment stays the same on a fixed-rate loan, but it does change your tax picture year by year as the deductible interest portion shrinks.
Neither depreciation nor the principal portion of amortization shows up in the cash-flow waterfall itself. They matter at tax time, not at the underwriting stage, which is why a CPA who understands rental real estate is worth involving once a deal moves from “does the math work” to “how much will I actually keep after taxes.”
What Experienced Investors Actually Check Before Buying
The investors who avoid bad deals aren’t running more sophisticated formulas. They’re stricter about inputs and faster to walk away. A go/no-go screen usually starts with three questions: does the rent match a lease or real comps, is the vacancy assumption realistic for this submarket, and does the CapEx reserve reflect the property’s actual age and components. Persistent vacancy history and HOA dues that climb faster than rent are the two red flags that kill more deals than any spreadsheet error.
Negotiation is where cash flow often gets fixed, not underwriting. Price reduction, a seller-paid rate buydown, or seller concessions toward closing costs can turn a marginal number into a workable one without changing a single assumption about the property itself. None of this replaces a conversation with a CPA once you’re weighing after-tax outcomes across multiple properties, since depreciation benefits vary by your income bracket and filing situation.
— Michael
Run Your Numbers With Real Estate Investor Toolkit’s Calculators
Every formula in this article maps directly to a field in Real Estate Investor Toolkit’s rental calculator, which is the fastest way to turn the math above into a decision on an actual property. Enter rent, vacancy, taxes, insurance, HOA, and management fees, then build your CapEx reserve component by component instead of guessing at a percentage.
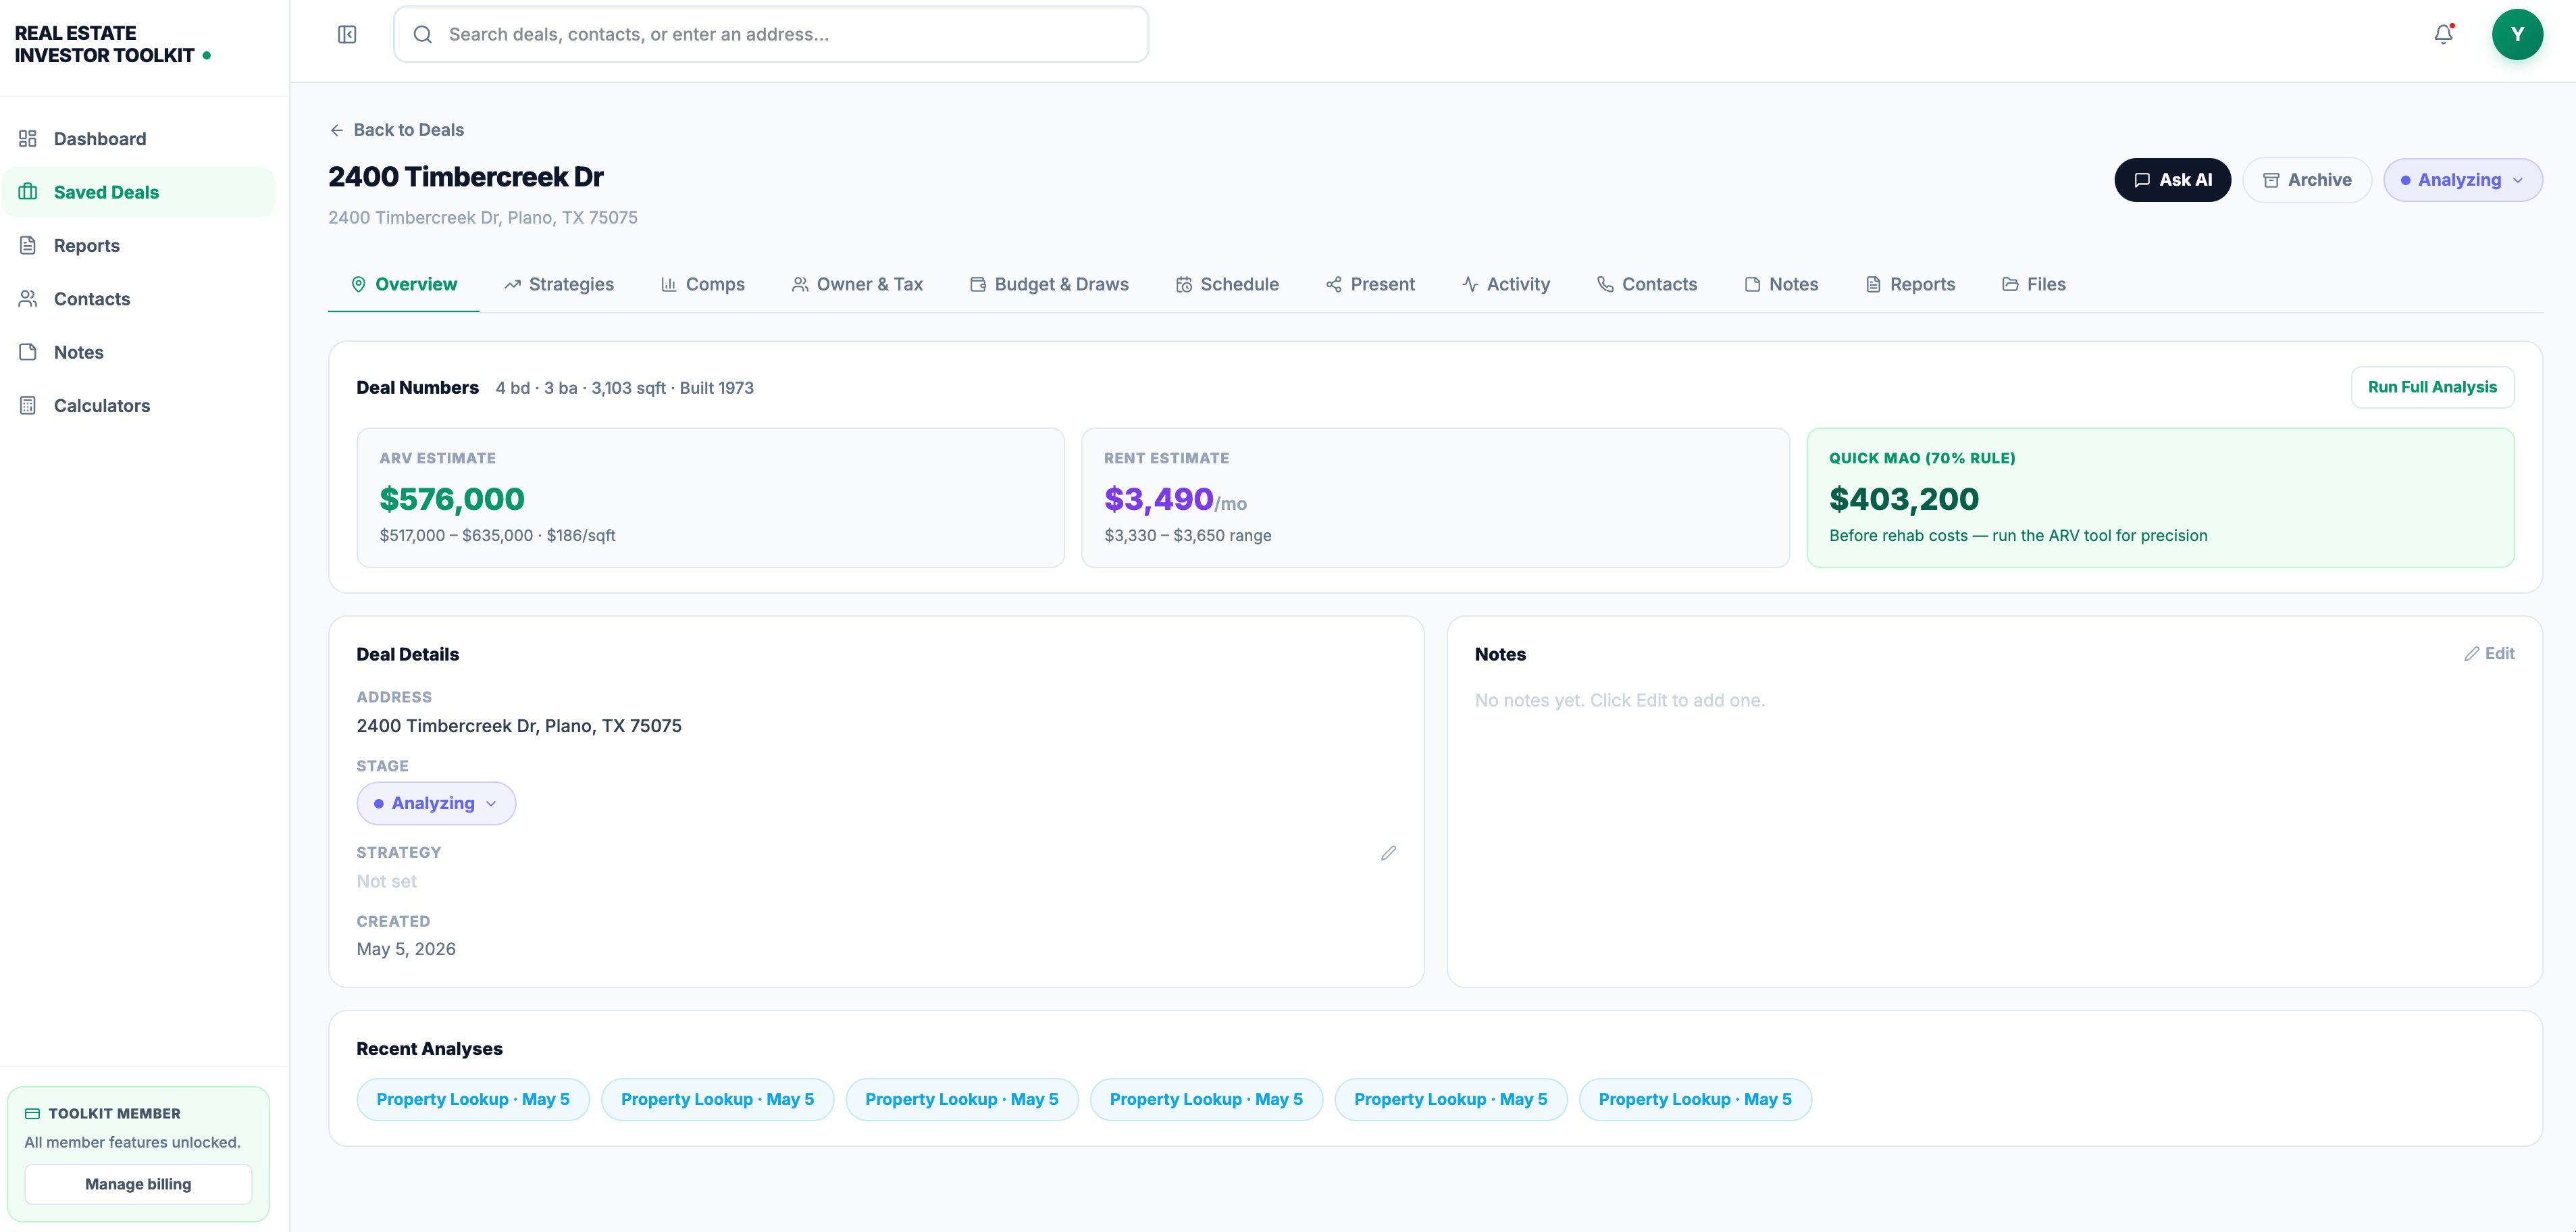
Pair it with the financing calculator to model debt service under different rate and down payment scenarios, and the rehab estimator when you need realistic component replacement costs for your reserve line. Every calculator saves your assumptions, so you can compare a conservative scenario against an optimistic one side by side instead of rebuilding the spreadsheet each time. No sign-up is required to run your first analysis. Start with the rental calculator and check whether your next deal clears the bar before you write the offer.
Sources
The Vertex42 rental cash flow template computes NOI, cap rate, and cash-on-cash side by side. Rocket Mortgage and Investopedia cover leverage and ROI mechanics in more depth.
This article is general information, not a substitute for advice from a qualified financial advisor. Consult a qualified financial professional about your own circumstances before acting on anything here.
FAQ
What Is the 7% Rule for Rental Property?
The 7% rule suggests annual rent should equal roughly 7% of the property’s purchase price, a stricter variant of the 1% rule used mostly as a fast, high-level screen rather than a substitute for line-item underwriting.
How Do You Calculate Cash Flow for a Rental Property?
Subtract vacancy loss and all operating expenses from gross scheduled rent to get net operating income, then subtract debt service; the Real Estate Investor Toolkit rental calculator automates this waterfall from your raw inputs.
What Is the 2% Rule for Rentals?
The 2% rule is a tighter screening heuristic than the 1% rule, suggesting monthly rent should equal about 2% of purchase price, though it rarely holds in higher-priced metro markets and works best on lower-cost properties.
What Is the 30% Rule for Rent?
The 30% rule is a tenant affordability guideline stating a household should spend no more than 30% of gross income on rent, not an investor underwriting metric, though it helps gauge whether local rents are sustainable for your tenant pool.
What’s the Difference Between Cap Rate and Cash-on-Cash Return?
Cap rate divides NOI by purchase price and ignores financing, making it useful for comparing markets, while cash-on-cash return divides cash flow by actual cash invested, making it the better metric once financing enters the decision.