Setting Vacancy Rate Assumptions That Hold Up in Underwriting

A conservative starting point is 4% to 7% economic vacancy for stabilized multifamily, with commercial asset classes running higher, and economic vacancy — not physical vacancy — is the number that belongs in your pro forma. First-year lease-up or post-rehab periods need their own, higher assumption modeled separately. Before you finalize any number, run a sensitivity test that adds three to five points and see if the deal still cash flows.
TL;DR:
- Using a 4% to 7% economic vacancy assumption for stabilized multifamily properties is standard, but short-term lease-up or rehab phases require higher estimates.
- Economic vacancy includes concessions and credit losses, which can significantly impact net operating income and property valuation if underestimated.
- A 3% to 5% increase in vacancy assumptions during sensitivity tests can determine if a deal remains cash flow positive or becomes too risky.
- Local market conditions, supply levels, and property quality should drive your vacancy assumptions more than national averages like 7.3%.
- Overreliance on physical vacancy without factoring in concessions or credit losses tends to inflate NOI estimates and overstate deal viability.
Table of Contents
- What Is the Difference Between Physical Vacancy and Economic Vacancy?
- How Does Vacancy Flow Into NOI and Property Valuation?
- What Are Typical Vacancy Rates by Property Type?
- How Do You Calculate Physical and Economic Vacancy?
- What’s a Reliable Checklist for Setting a Vacancy Assumption?
- How Do You Stress-Test a Vacancy Assumption?
- How Can You Reduce Vacancy Risk and Turnover Costs?
- How Do You Model Vacancy Using Real Estate Investor Toolkit Calculators?
- Why Most Vacancy Assumptions in Underwriting Are Too Optimistic
- Run Your Vacancy Scenarios Before You Make an Offer
- Sources
What Is the Difference Between Physical Vacancy and Economic Vacancy?
Physical vacancy measures empty units. The formula is straightforward: vacant days divided by total available days, expressed as a percentage.
Economic vacancy measures lost revenue, and it’s the figure that actually belongs in underwriting. The formula is (Gross Potential Rent − Actual rental income) / Gross Potential Rent, and it captures more than empty units. It also absorbs concessions, credit loss from unpaid rent, and below-market lease terms that physical vacancy never sees.
- Physical vacancy: counts empty days only
- Economic vacancy: counts empty days plus concessions and credit loss
- Market vacancy: a submarket-wide average that contextualizes your property, not a substitute for it
Vacancy vs. credit loss: Credit loss is rent owed but never collected. Institutional underwriters often model it separately, then combine it with vacancy on one line for the pro forma. Treat both conservatively, especially on residential assets where eviction timelines can stretch a bad debt into several months of lost rent.
How Does Vacancy Flow Into NOI and Property Valuation?
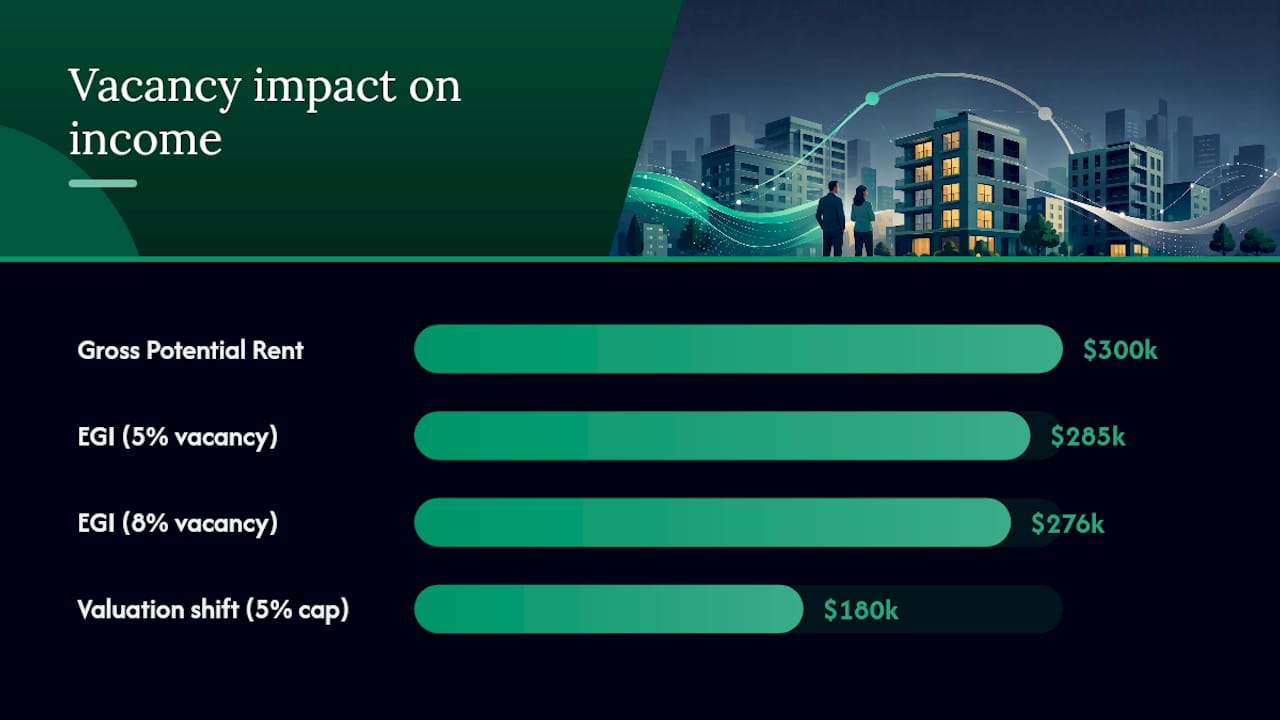
Every pro forma follows the same chain: Gross Potential Rent, minus economic vacancy, equals Effective Gross Income, minus operating expenses, equals Net Operating Income. NOI then gets capitalized into a valuation. A vacancy assumption sitting a couple of points off can move that valuation by tens of thousands of dollars on a mid-size property.
Here’s a simple illustration. A 20-unit property generating $300,000 in Gross Potential Rent will produce very different results depending on the vacancy line:
- At 5% economic vacancy: EGI lands at $285,000
- At 8% economic vacancy: EGI drops to $276,000, a $9,000 swing
- At a 5% cap rate, that $9,000 NOI difference alone shifts valuation by $180,000
Watch for the “seller pro forma trap.” Sellers frequently market a property using trailing 12 months of actual collections during a strong stretch, or worse, a forward-looking pro forma that assumes zero turnover. Lenders discount these numbers automatically, and economic vacancy is the correct input for reconciling the gap between what a seller claims and what a bank will actually underwrite.
What Are Typical Vacancy Rates by Property Type?
Stabilized economic vacancy ranges vary meaningfully by asset class, and treating every property type the same is one of the most common underwriting errors analysts make.
These ranges come from operating cash flow modeling standards used across commercial underwriting, and they hold up as reasonable starting points for stabilized assets in normal markets. Short-term rentals don’t fit neatly into this framework at all. Because nightly bookings behave more like a hotel occupancy curve than a lease, model them on booking-platform occupancy data for the specific submarket rather than a standard vacancy percentage.
The national rental vacancy rate for Q2 2026 was 7.3%, according to the U.S. Census Bureau’s quarterly housing survey, with a margin of error of roughly 0.246 percentage points at a 90% confidence interval. This figure serves as a national benchmark rather than a submarket target. National vacancy statistics hide enormous dispersion between metros, so treat 7.3% as context for how the broader rental market is trending, then adjust hard for your actual submarket.
A few modifiers matter more than any table can capture: a strong submarket with limited new supply pushes your assumption toward the low end of the range, while heavy construction deliveries or a Class C property competing against renovated Class A stock should push it higher. Rocket Mortgage notes that vacancy rates between 5% and 10% are generally considered typical in balanced markets, but “typical” varies enormously by location and property condition.
How Do You Calculate Physical and Economic Vacancy?
Both calculations are simple once you know which inputs go where.
Physical vacancy (days-based):
- Count total vacant days across the period you’re measuring
- Divide by total available unit days for that same period
- Multiply by 100 for a percentage
Example: a unit sits empty for 45 days out of a 365-day year. That’s 45 ÷ 365, or 12.3% vacancy for that unit alone.
Economic vacancy (revenue-based):
- Calculate Gross Potential Rent, meaning what every unit would generate at full market rent with zero vacancy
- Subtract actual collected rental income, net of concessions and bad debt
- Divide the difference by Gross Potential Rent
If GPR is $500,000 and actual collections after a $6,000 concession package and $4,000 in unpaid rent land at $460,000, economic vacancy is $40,000 divided by $500,000, or 8%.
For portfolios, aggregate at the unit level first. Sum every unit’s vacant days, divide by the sum of every unit’s available days, and you get a blended physical vacancy rate that won’t get distorted by a single long-vacant unit skewing an average taken across properties instead of days.
What’s a Reliable Checklist for Setting a Vacancy Assumption?
Building the assumption is a sequence, not a guess. Work through it in this order every time:
- Collect data. Pull the property’s trailing three-year occupancy history, current submarket vacancy from a local market report, and the lease rollover schedule for the next 12 to 24 months.
- Adjust for competitive position. A property priced above its comp set, or lacking amenities competitors offer, should carry a higher assumption than the submarket average. Trailing occupancy, submarket vacancy, competitive position, and lease rollover together form the core input set analysts rely on.
- Factor in supply. Check permitting and construction data for units delivering within your hold period. Heavy new supply nearby pushes your assumption up regardless of current performance.
- Convert to economic vacancy. Add expected credit loss and concessions to your physical vacancy estimate to arrive at the number that actually belongs in the pro forma.
- Separate stabilized from lease-up. A property coming out of a rehab or a new construction delivery needs its own, higher first-year assumption, distinct from the long-term stabilized rate.
- Trailing occupancy: pull from rent roll or property management software, not a broker’s summary
- Submarket vacancy: use a paid data service or a recent appraisal, not a five-year-old article
- Lease rollover: flag any month where more than 15% of units expire simultaneously
Pro Tip: Never let a single trailing-12-month number set your assumption. A property that happened to have zero turnover last year isn’t lower risk. It’s overdue.
How Do You Stress-Test a Vacancy Assumption?
Vacancy rarely moves alone. When a submarket softens, concessions and credit loss typically rise right alongside it, so a realistic sensitivity test should move all three together rather than isolating vacancy in a vacuum.
- Base case: stabilized assumption from your checklist, say 6% economic vacancy
- Tight scenario: vacancy at 4%, minimal concessions, near-zero credit loss
- Soft scenario: vacancy at 9% to 11%, concessions up two to three points, credit loss up one point
| Scenario | Economic vacancy | NOI impact | Cash-on-cash |
|---|---|---|---|
| Tight | 4% | +$1,000 | Improves ~0.4 pts |
| Base | 6% | Baseline | Baseline |
| Soft | 10% | −$nil | Drops nearly a full point |
Set a decision threshold before you run the numbers, not after. A common rule: if the soft scenario still produces positive leveraged cash flow and a debt service coverage ratio above 1.15, the deal passes. If soft-case cash flow turns negative, the deal is too thin on margin for the level of vacancy risk in that market, and you should either renegotiate price or walk. The financing calculator is where this DSCR sensitivity becomes concrete rather than theoretical.
How Can You Reduce Vacancy Risk and Turnover Costs?
Lower vacancy isn’t just an underwriting assumption. It’s a set of operational choices you make once you own the asset.
- Price units within 2% to 3% of comparable listings; overpricing by more adds measurable days on market
- Pre-lease renewing tenants 60 to 90 days before expiration with a modest renewal incentive
- Budget a dedicated marketing spend per vacant unit rather than relying on organic listing traffic
- Track days-to-lease by unit type monthly so you catch a slowing trend before it compounds
Turnover costs are the part investors consistently undercount. Cleaning, paint touch-ups, minor repairs, and marketing typically run several hundred to over a thousand dollars per unit turn, depending on unit size and condition, and that cost belongs in your operating budget or a dedicated turnover reserve, not as a surprise line item.
Pro Tip: If your strategy is value-add, a higher first-year vacancy assumption isn’t a red flag. It’s the cost of repositioning. Just make sure your rehab and holding-cost math actually supports the projected rent bump on the other side.
How Do You Model Vacancy Using Real Estate Investor Toolkit Calculators?
Turning a vacancy assumption into a real underwriting decision takes minutes with the right tool. The rental property calculator lets you enter historical occupancy, set a year-one lease-up rate separate from your stabilized assumption, and run both side by side.
- Enter trailing occupancy and submarket vacancy into the cash flow fields
- Set a separate first-year vacancy rate if the property needs lease-up or rehab
- Adjust concessions and credit loss inputs to convert physical vacancy into economic vacancy
- Run the tight and soft scenarios from your sensitivity test and compare cash-on-cash side by side
The calculator requires no sign-up, so you can test a scenario in the time it takes to read a listing. Try running your target property at both the Census benchmark of 7.3% and your submarket-adjusted number to see how much the gap actually matters for your specific deal.
Why Most Vacancy Assumptions in Underwriting Are Too Optimistic
The biggest mistake I see in underwriting isn’t a bad vacancy number. It’s using physical vacancy when the deal needs economic vacancy. A pro forma that only counts empty days and ignores concessions and credit loss will consistently overstate NOI, sometimes by enough to flip a deal from viable to underwater once a lender’s underwriter rebuilds it properly.
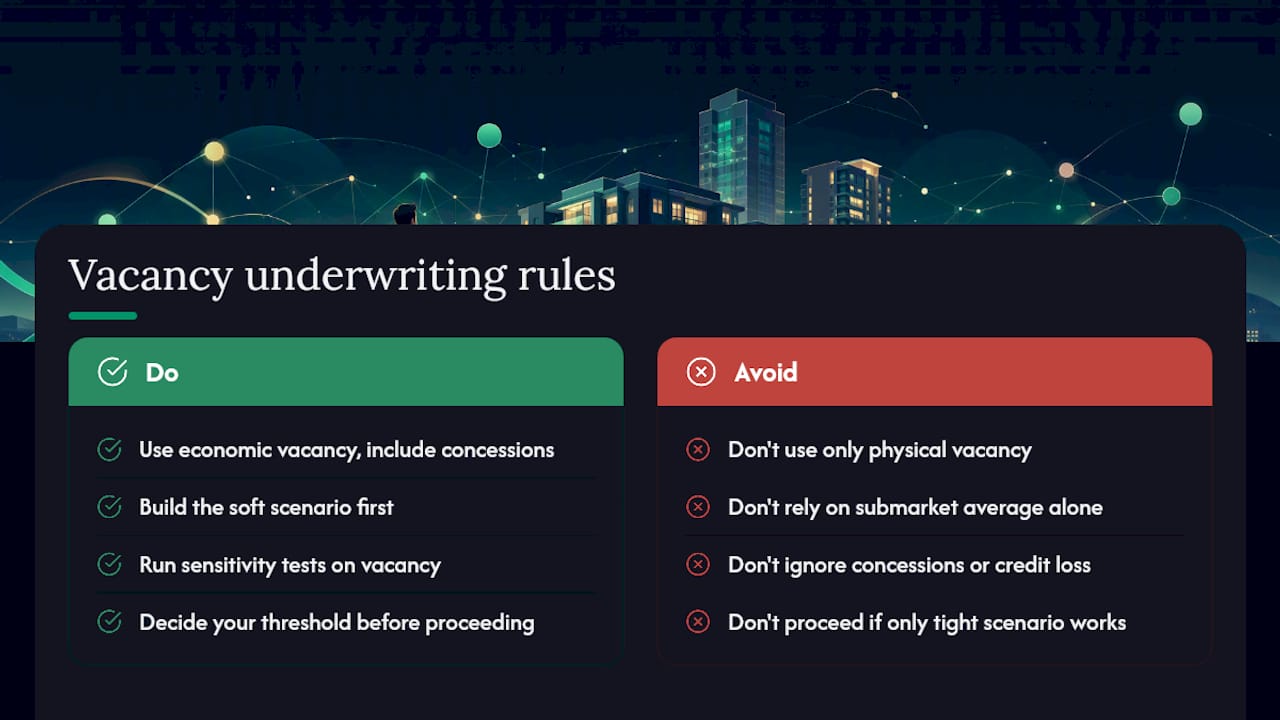
Conventional advice tells investors to “check the local vacancy rate,” which is true but incomplete. A submarket average tells you nothing about whether your specific property is priced right, facing new supply, or carrying deferred maintenance that will extend days-to-lease past the norm. The Census benchmark and industry range tables are starting points, not answers.
What actually separates a defensible underwriting package from a hopeful one is the sensitivity test. If your deal only works at the tight-scenario vacancy rate, it doesn’t work. Build the soft scenario first, decide your threshold, and let that discipline, not optimism, determine whether you move forward.
— Michael
Run Your Vacancy Scenarios Before You Make an Offer
Spreadsheets are fine for a first pass, but they don’t catch a lease-up assumption you forgot to separate from your stabilized rate, and they won’t flag a DSCR that quietly drops below 1.0 in your soft scenario. The rental property calculator does both automatically, with no sign-up required, so you can stress-test a deal the same afternoon you tour it.
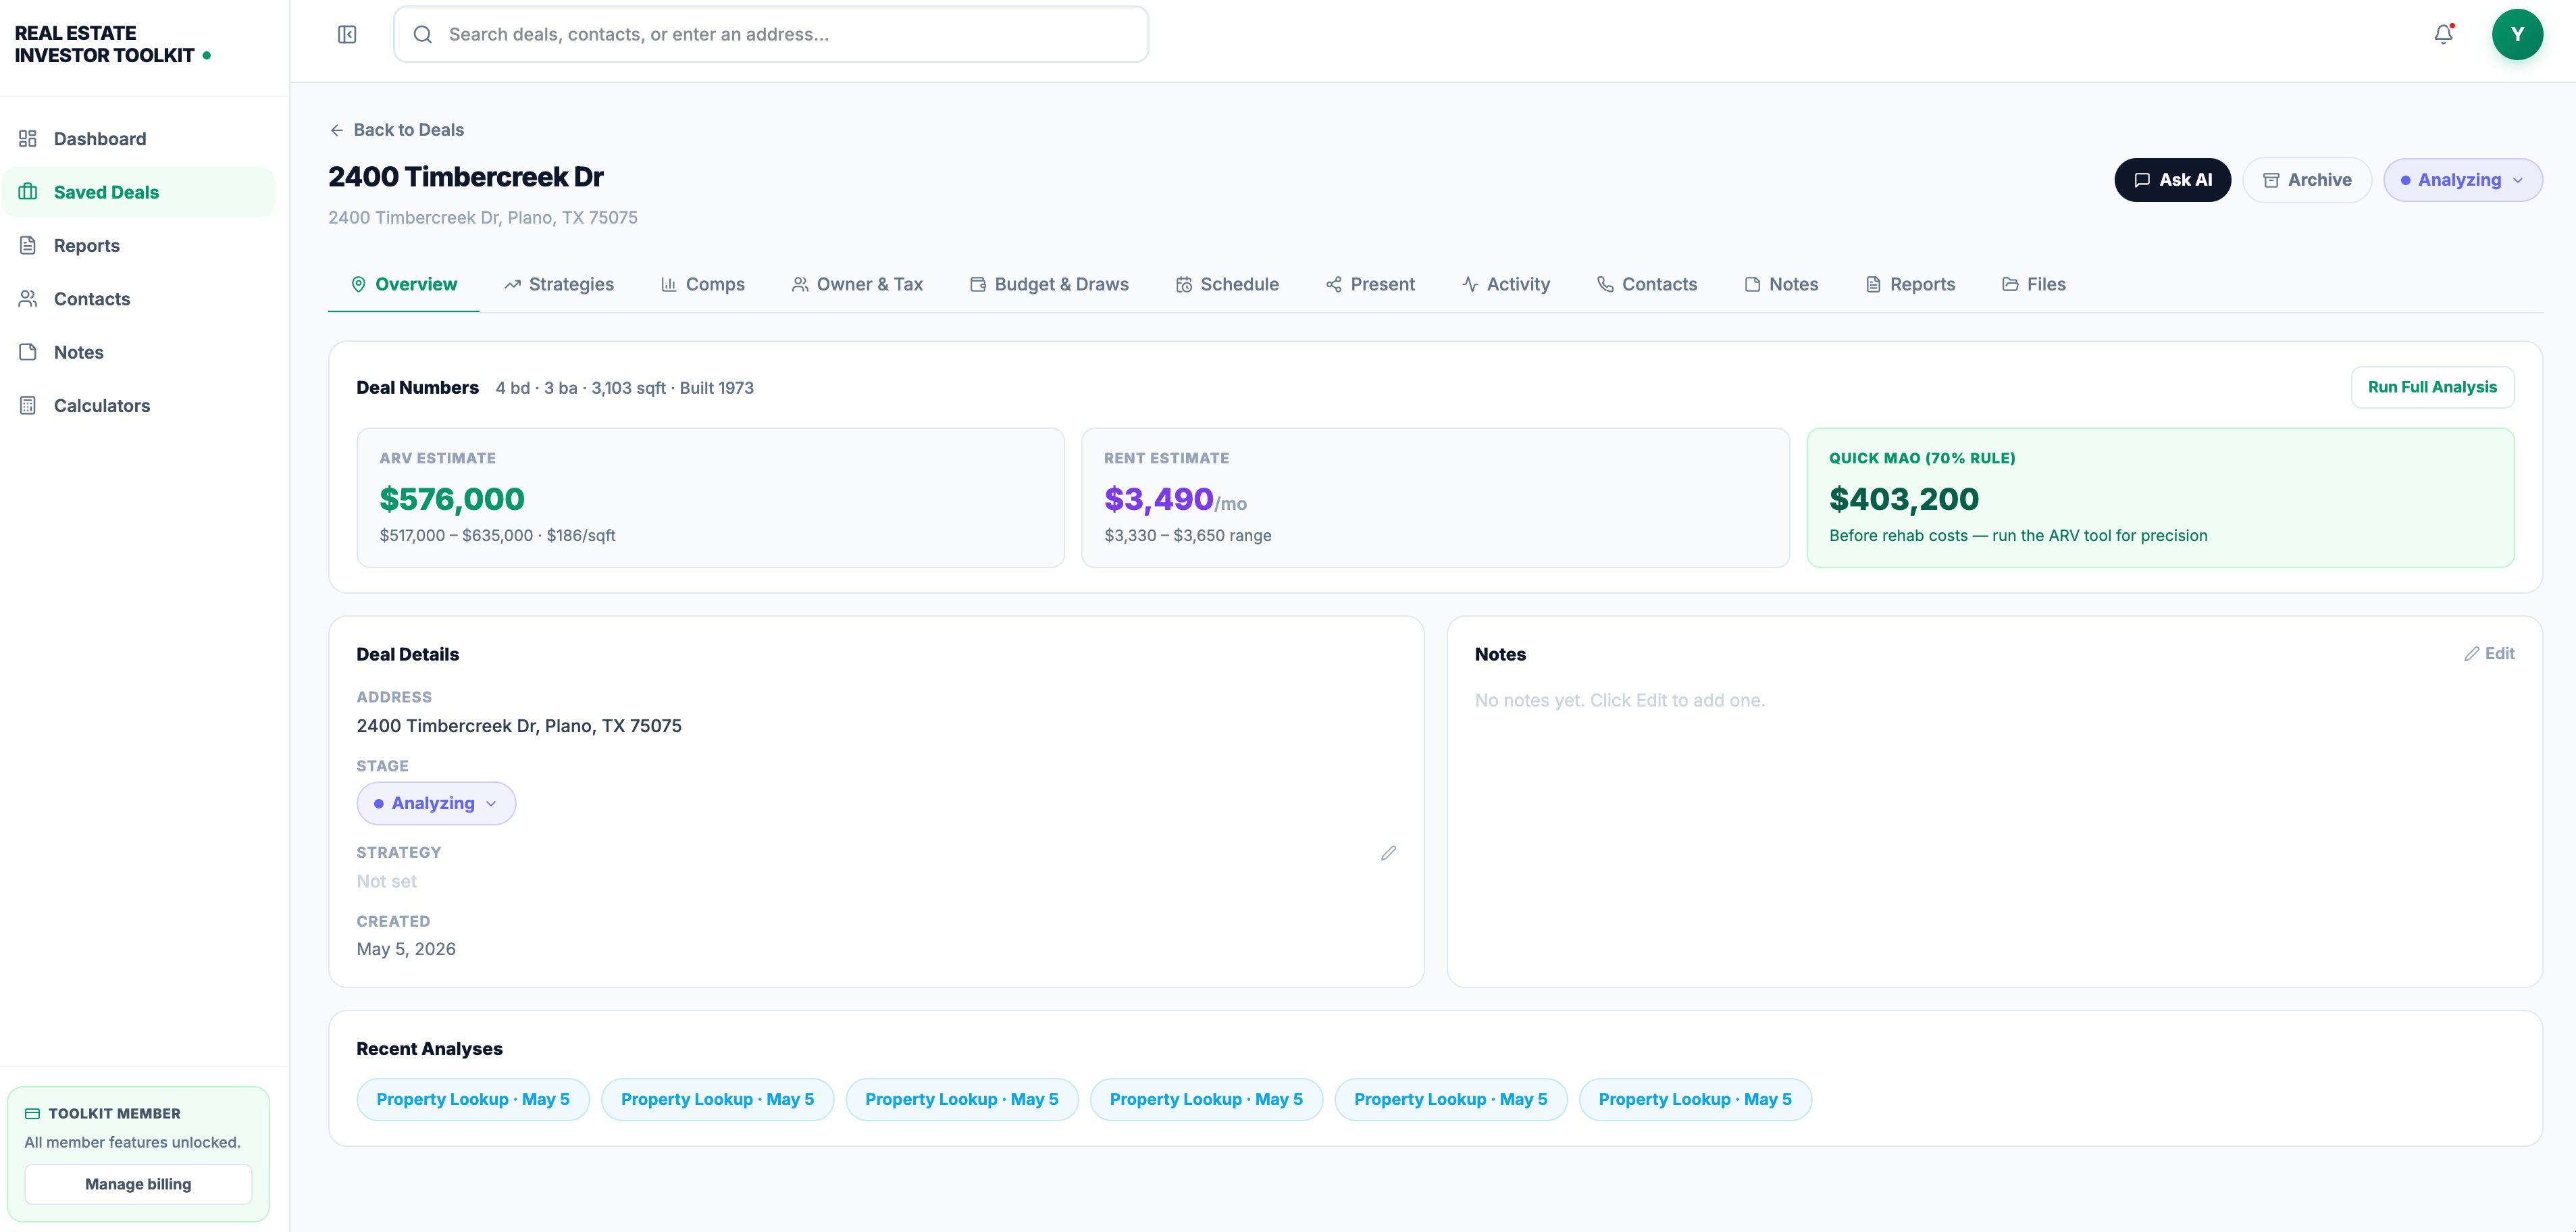
Enter the property’s trailing occupancy, set your stabilized and first-year vacancy assumptions separately, and layer in concessions and credit loss to see the real economic vacancy number. If the deal involves financing, pair it with the investment property financing calculator to check how a vacancy swing moves your debt service coverage ratio before a lender does it for you. For a deeper walkthrough of how vacancy fits into the rest of the pro forma, the rental property analysis guide covers the full picture, and readers comparing modeling approaches across platforms can find additional context in this roundup of investment property calculators. Save or export your scenario report once the numbers hold up, so you have it ready when you sit down with a lender.
Sources
- Quarterly Residential Vacancies and Homeownership, Second Quarter 2026 — U.S. Census Bureau
- Operating cash flow projection: drivers & assumptions — APERS
- Economic vacancy — Wall Street Prep
Recommended
- How to Estimate Holding Costs Before They Kill the Flip Spread — Real Estate Investing Guide | Real Estate Investor Toolkit
- How to Pull Comps in Non-Disclosure States Without Fooling Yourself — Real Estate Investing Guide | Real Estate Investor Toolkit
- How to Analyze a Rental Property: Cash Flow, Cap Rate, and the 1% Rule — Real Estate Investing Guide | Real Estate Investor Toolkit