Short Term Rental Analysis Investors Can Use to Pass Underwriting

A reliable short term rental analysis models ADR and occupancy separately for each month, then underwrites to a conservative scenario rather than an optimistic annual average. The key outputs are annual gross revenue, a full operating expense stack, net operating income, debt service, and cash-on-cash return. Start with vetted data sources, then run the numbers through a calculator built for the job.
TL;DR:
- A full revenue projection should be built month by month to account for seasonal fluctuations and demand-driven peaks rather than using an annual average.
- Location within a market significantly impacts ADR and occupancy, with proximity to attractions and amenities dictating higher rates and booking stability.
- Confirm licensing, zoning, and tax compliance directly with local authorities, and treat regulatory risks as a concrete operating expense line item.
- Use validated market and comp data to set conservative occupancy and ADR assumptions for each month, accommodating local events and tourism trends.
- Running multiple stress scenarios, including downturns and increased supply, helps ensure the deal maintains positive cash flow under market adversity.
Table of Contents
- How to pick the right market and city for STR investing
- Narrowing to neighborhoods and property-level filters
- Regulatory diligence: model compliance as an operating risk
- Monthly revenue modeling: build a 12-month ADR × occupancy matrix
- Full expense stack and how to model operating costs for STRs
- Qualitative competitor and supply analysis for pricing and positioning
- Define your ideal guest and the pricing/amenity strategy that matches them
- Return metrics and the decision rule: NOI, cash-on-cash, and break-even occupancy
- Practical toolkit: how the publisher’s calculators speed an STR analysis
- Advanced pricing strategies and dynamic pricing tools
- Impact of local events and tourism trends on occupancy and rates
- Impact of platform choice (Airbnb, Vrbo, etc.) on performance metrics
- Scenario analysis including economic downturns and market saturation
- Author perspective: common underwriting mistakes and practical shortcuts
- How the Real Estate Investor Toolkit speeds up your STR model
- Sources
- FAQ
How to pick the right market and city for STR investing
Market selection starts with demand signals, not a hunch. Look at occupancy trends over at least a full year, the ADR band for comparable unit types, and RevPAR, since this single metric blends rate and occupancy into one comparison point across cities. Seasonality profile matters just as much: a market with one dominant peak season carries more revenue risk than one with two or three demand periods spread across the year.
Macro inputs round out the picture. Transport access (a major airport, an interstate corridor), recurring event drivers (festivals, conventions, sports seasons), and the length of the regional tourist season all shape how durable the ADR and occupancy numbers will be.
- Occupancy below 45% annually for a market signals either oversupply or weak demand, both worth investigating before you buy.
- A RevPAR that has declined for two consecutive years despite rising ADR often points to falling occupancy, a red flag for new supply.
- Short, single-season markets need higher shoulder-season occupancy assumptions built into your conservative case.
Pull this data from municipal tourism boards, STR-specific market reports, and rental comps analysis tools rather than relying on a single listing site’s averages.
Narrowing to neighborhoods and property-level filters
Markets hide wide performance gaps inside their own borders. Two listings three miles apart can show a 20-point occupancy gap because one sits near a stadium or boardwalk and the other does not. Identify the above-average pockets by comparing ADR and occupancy for similar unit types block by block, not just city-wide.
Proximity to beaches, downtown entertainment districts, and major employers moves both ADR and occupancy more than almost any amenity you can add after purchase. Parking, a private hot tub, or a dedicated workspace can justify a rate premium, but location sets the ceiling.
- Check review counts and recency: a listing with 150+ reviews and consistent five-star ratings over 12 months is a stronger comp than a new listing with ten reviews.
- Look at the booking window: properties booked 30 to 60 days out typically carry more pricing power than last-minute-fill properties.
- Scan for minimum-stay patterns and professional photography, both signs of active, revenue-optimized management you are competing against.
Regulatory diligence: model compliance as an operating risk
Short-term rental regulation varies by city and sometimes by neighborhood within the same city, covering licensing, zoning overlays, occupancy taxes, and fire or safety inspections. Treat this as a line item in your model, not a footnote. A municipal review of short-term rentals found that enforcement gaps are common and often depend on platform reporting rather than proactive city detection, with hundreds of listings tied to inactive or expired licenses in that jurisdiction alone.
Verify license status directly with the local permitting office rather than trusting a listing’s “licensed” badge, and confirm whether the city requires occupancy tax remittance through the platform or separately by the host.
- Request the property’s license number and confirm its active status with the city before closing.
- Check whether the zoning allows short-term use outright or only under a conditional permit.
- Build a compliance stress case: assume several months offline for re-licensing or a fine if enforcement tightens.
Pro Tip: Call the city’s licensing department directly; a five-minute phone call often surfaces rule changes that have not yet reached general real estate listings.
Monthly revenue modeling: build a 12-month ADR × occupancy matrix
Annual averages hide the exact risk you need to see. Underwriting guidance for short-term rental financial models recommends building revenue month by month rather than applying one blended rate across the year, since STR revenue can swing substantially between peak and shoulder months.
- List available nights per month (28 to 31, adjusted for any planned owner blocks).
- Assign an ADR for each month based on seasonal comps, not a single annual figure.
- Assign an occupancy rate for each month, pulling from validated market or comp data.
- Multiply available nights by ADR by occupancy to get each month’s gross revenue.
- Sum all 12 months for an annual gross revenue figure, then repeat for three scenarios.
Build three cases: conservative, base, and optimistic.
National STR occupancy around the mid-50% range is a reasonable baseline for a typical market, with stronger markets targeting higher than that in a base case. Adjust monthly inputs around local events, school calendars, and known seasonal patterns rather than smoothing them into one average.
Full expense stack and how to model operating costs for STRs

Short-term rental expenses run heavier than a standard long-term lease because of turnover frequency and platform fees. A complete stack includes OTA commissions, property management fees, cleaning costs per turnover, utilities, supplies, insurance, occupancy and sales taxes, routine maintenance, channel-management or pricing software, marketing, and a CapEx reserve for furniture and appliance replacement.
Allocate each cost by behavior. OTA commissions and cleaning scale with bookings, so model them as a percentage of revenue or a per-stay fee. Insurance, software subscriptions, and property taxes are fixed monthly costs regardless of occupancy. Property management fee structures typically run as a percentage of revenue, so confirm that rate before assuming a flat figure.
- OTA commissions and payment processing typically run as a percentage of booking revenue, varying by platform.
- Cleaning and turnover costs scale directly with the number of stays, not nightly rate.
- CapEx reserves cover furniture, appliances, and periodic refreshes; skipping this line is the single most common underwriting mistake.
Pro Tip: Build your CapEx reserve as a fixed monthly dollar amount from day one, even in the conservative case, so a replacement cycle never catches your cash flow off guard. Guidance on structuring CapEx reserves can help you size this line realistically. Operating expenses commonly run between roughly half and two-thirds of gross revenue before debt service, and any model projecting expenses below about a third deserves a second look.
Qualitative competitor and supply analysis for pricing and positioning
Before setting your ADR target, scan the nearby competitive set directly on the booking platforms. Professional photography, high review counts with fast response rates, and frequent calendar turnover all signal an actively managed, high-performing listing you will be competing against for bookings.
- Count how many comparable listings show professional management signals versus owner-operated, casual listings.
- A market saturated with professionally managed units usually holds pricing discipline better than one full of casual hosts racing to the bottom.
- Infer your achievable ADR and booking window by averaging the top quartile of comparable listings, not the full set.
Define your ideal guest and the pricing/amenity strategy that matches them
Guest segments carry different economics. Short leisure stays of a few nights command the highest nightly rates but the most turnover cost. Medium-stay families often book a week and value space and kitchen amenities over location precision. Extended-stay remote workers trade a lower nightly rate for 20-plus night bookings that cut cleaning frequency and vacancy risk.
- A dedicated workspace and reliable high-speed internet justify longer minimum stays aimed at remote workers.
- A pool, hot tub, or game room supports premium ADR for short leisure stays.
- Favor occupancy over rate in shoulder seasons; favor rate over occupancy during confirmed peak weeks.
Return metrics and the decision rule: NOI, cash-on-cash, and break-even occupancy
Once revenue and expenses are modeled, the math converts into a decision. Subtract total operating expenses from gross revenue to get NOI. Subtract annual debt service from NOI to get cash flow before taxes. Divide that cash flow by your total cash invested to get cash-on-cash return, and divide NOI by purchase price for the cap rate.
- Calculate NOI: gross revenue minus all operating expenses.
- Calculate annual cash flow: NOI minus debt service.
- Calculate cash-on-cash: annual cash flow divided by total cash invested.
- Calculate break-even occupancy: the occupancy rate at which revenue exactly covers expenses and debt service.
Break-even occupancy is one of the most useful sanity checks in the model, since it translates every assumption into a single, comparable number you can stress against your conservative case. A rental property calculator built for cash flow, cap rate, and ROI can run these calculations directly from your monthly revenue and expense inputs once you have them modeled. Higher leverage raises cash-on-cash but also raises break-even occupancy, so test both a conservative financing scenario and a higher-leverage one before committing.
Practical toolkit: how the publisher’s calculators speed an STR analysis
A rental property calculator turns your modeled monthly revenue and expense inputs into NOI and cash-on-cash instantly. A rehab cost calculator sizes your CapEx reserve, and an ARV calculator checks your exit assumptions. All run without requiring an account, so you can test numbers before committing to a deeper analysis.
- Rental cash flow calculator: populates NOI, cash-on-cash, and cap rate cells.
- Rehab cost estimator: sizes CapEx reserve and initial furnishing budget.
- ARV calculator: validates exit-value assumptions for the optimistic case.
Advanced pricing strategies and dynamic pricing tools
Static nightly rates leave money on the table in most STR markets. Dynamic pricing tools adjust ADR daily based on local demand signals, booking pace, day of week, and lead time, typically outperforming a flat rate set once a season.
A sound pricing strategy layers several tactics. Length-of-stay discounts encourage longer bookings that cut cleaning frequency and vacancy risk between guests. Last-minute discounting fills gaps inside a seven-day window without undercutting your base rate structure. Early-booking premiums capture guests locking in peak dates months ahead, when price sensitivity is lower.
Weekday versus weekend pricing matters in almost every market, since Friday and Saturday nights typically command a premium over midweek stays. Event-based surge pricing, applied around confirmed local events like festivals or major sports dates, can lift ADR substantially for a handful of nights a year without affecting your baseline rate.
When modeling, do not assume a dynamic pricing tool will outperform your conservative case by a fixed percentage. Instead, build the conservative case on a disciplined manual rate strategy, and treat any lift from automated pricing as upside in the base or optimistic case. This keeps your underwriting floor honest while still capturing the real benefit experienced operators see from responsive pricing.
Impact of local events and tourism trends on occupancy and rates
Local events reshape monthly occupancy and ADR more than almost any other variable in the model. A major convention, a marathon weekend, or a recurring festival can push a single week’s occupancy and rate well above the monthly average, while the weeks immediately before and after may dip below it as travelers shift their dates.
Build an events calendar for your target market covering the next 12 to 18 months, pulling from the city’s tourism board, convention center schedule, and major venue calendars. Map each confirmed event against your monthly ADR and occupancy matrix, and adjust individual weeks rather than smoothing the lift across the whole month.
Tourism trend shifts matter over a longer horizon. A market segmentation report on the vacation rental sector notes that medium-length stays and extended stays are significant demand segments alongside traditional short leisure trips, a signal that guest mix, not just event-driven demand, shapes revenue stability over a full year.
Do not bake every known event into your base case at full assumed lift. Treat recurring, well-established events as base-case inputs and newer or less certain events as optimistic-case upside, since attendance and travel patterns can shift year to year.
Impact of platform choice (Airbnb, Vrbo, etc.) on performance metrics
Listing on multiple platforms rather than a single one generally widens your booking funnel, but it changes your expense stack and operational complexity too. Each platform carries its own commission structure, cancellation policy, and guest demographic, which shows up directly in your ADR and occupancy numbers.
OTAs remain the dominant booking channel for short-term rentals, and vacation rental market segmentation reporting confirms that OTA distribution continues to drive the bulk of reservations across the sector. That makes OTA commission rates a core, not optional, line in your expense model.
Multi-platform listing, often called a multi-channel strategy, requires a channel manager to sync calendars and avoid double-bookings, adding a software cost but typically reducing vacancy risk compared to a single-platform listing. Guest demographics also shift by platform: one platform may skew toward younger leisure travelers booking shorter stays, while another may attract more family bookings with longer minimum stays.
When modeling occupancy and ADR, confirm which platform (or combination) your comp set is drawn from. A comp pulled entirely from one platform’s data may not reflect what your property would earn across a multi-channel strategy, and mixing single-platform comps into a multi-platform revenue projection can overstate or understate your numbers depending on which channel historically performs better in that specific market.
Scenario analysis including economic downturns and market saturation
A conservative base case is not the same as a downturn case. Build a separate stress scenario that models what happens if regional travel demand contracts, discretionary travel spending tightens, or a wave of new STR supply enters your specific neighborhood within the next 12 to 24 months.
For an economic downturn scenario, drop occupancy across all months by a meaningful margin below your conservative case, particularly in shoulder-season months that already carry thinner demand, and hold or slightly reduce ADR to reflect guests trading down to lower price points. Recalculate break-even occupancy under this scenario to see how much cushion the deal actually has.
For a market saturation scenario, model what happens if comparable supply in your immediate area grows substantially, a realistic risk in markets where STR licensing is easy to obtain. Increased supply typically pressures ADR first, as new listings undercut established ones to build review history, and occupancy second, as the overall booking pool gets split across more units.
Run both scenarios against your financing assumptions, since a highly leveraged purchase has far less room to absorb a downturn or saturation scenario than one financed more conservatively. If the deal still produces positive cash flow under a combined downturn-and-saturation stress test, that is a strong signal the underwriting has real margin built in rather than relying on best-case assumptions holding indefinitely.

Author perspective: common underwriting mistakes and practical shortcuts
The most frequent errors are using one annual average, skipping CapEx reserves, and trusting a single occupancy source. The fastest fix is a conservative floor, a calendar-pattern check, and a direct call to the licensing office.
— Michael
How the Real Estate Investor Toolkit speeds up your STR model
Running the full matrix by hand works, but it is slow and error-prone when you are screening several properties at once. The rental property calculator takes your monthly revenue and expense inputs and returns NOI, cash-on-cash, and cap rate without a signup. The rehab estimator sizes your CapEx reserve, and the ARV calculator checks your exit assumptions for the optimistic case.
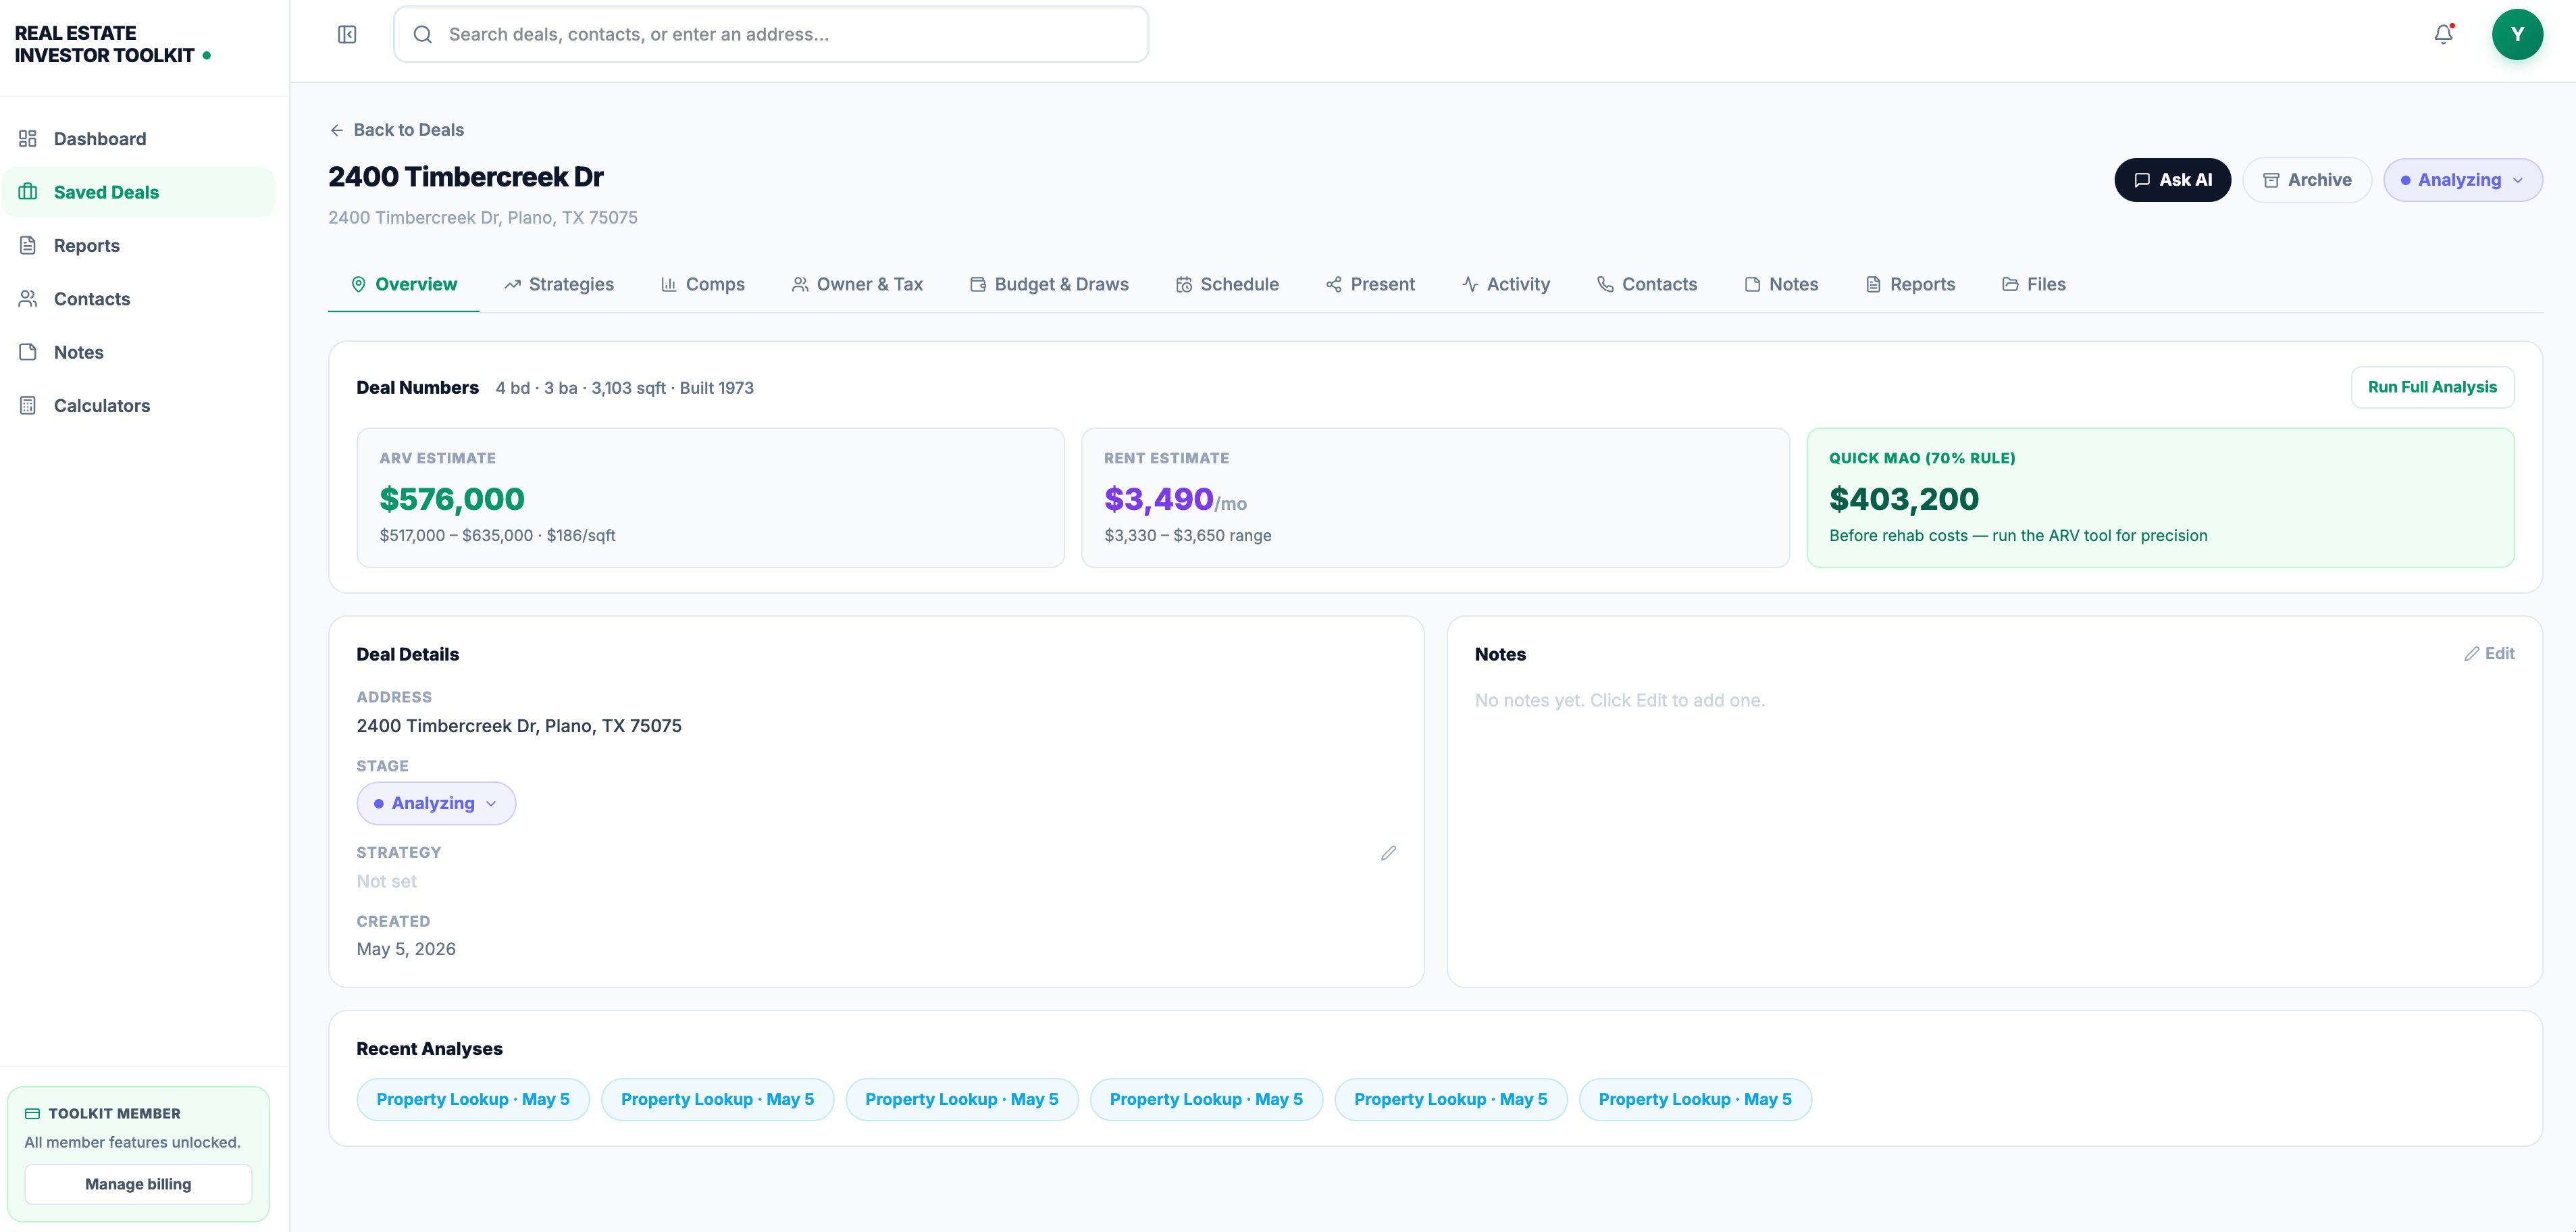
Start with the free calculators to screen a deal in minutes, then upgrade to the Real Estate Investor Toolkit plan at $39.99 per month when you need saved pipelines, owner data, and unlimited reports for ongoing deal flow.
Sources
Direct data from property management software or a host’s own booking system reflects actual reservations. Scraped OTA data, pulled from public calendars, is an estimate. Research on daily-scrape methods for Airbnb listings found that calendar dates marked unavailable are not always booked nights; hosts frequently block dates for personal use, maintenance, or testing new pricing, which can inflate apparent occupancy if you treat every blocked date as a paid stay.
Before trusting any vendor’s occupancy figure, confirm how they define an “active listing” and an “occupied night.” Ask whether blocked dates are excluded from the denominator.
- Short-Term Rental Financial Model: The Complete Underwriting Guide | Hostfully
- City Controller short-term rentals review (June 2026) | Philadelphia Controller’s Office
- United States Short-term Vacation Rental Market Size, Share & 2031 Growth Trends Report | Mordor Intelligence
FAQ
What is the 7% rule for rental property?
The 7% rule is an informal screening guideline some investors use to estimate whether a rental property’s annual income could reach a certain percentage of its purchase price, though definitions and thresholds vary by investor and market. It is best used as a quick screen, not a substitute for a full monthly revenue and expense model.
Is there a free app that can analyze Airbnb income?
Several calculators let you estimate rental income and cash flow without signing up, including the rental property calculator, which computes NOI, cash-on-cash, and cap rate from your revenue and expense inputs. Pair any free calculator with vetted ADR and occupancy data rather than relying on its built-in estimates alone.
What is the 75-55 rule for Airbnb?
Definitions of this rule vary across investor communities and are not standardized by any primary industry source, so treat any specific percentage pairing with caution. A monthly ADR by occupancy matrix with conservative, base, and optimistic cases gives a more defensible picture than a single rule-of-thumb ratio.
What is the 2% rule for rentals?
Short-term rental underwriting generally relies on the full monthly revenue and expense model instead, since nightly rate volatility and seasonal swings make a flat percentage rule less reliable.
How do you calculate break-even occupancy for a short-term rental?
Run this figure against your conservative case using a rental property calculator to confirm the deal has margin before a downturn or seasonal dip.