Sensitivity Analysis in Real Estate: A Practical Guide

Sensitivity analysis in real estate means changing one assumption in your deal model, such as ARV, rehab cost, rent, vacancy or interest rate, and watching how profit, cash flow or return responds. It shows you which numbers your deal depends on most, so you can check those first and walk away when a small miss turns a good deal into a bad one. You do not need a finance degree or an expensive modeling suite. You need a base case, a realistic range for each input, and the discipline to test them one at a time.
This guide explains the method, then works through a fix-and-flip example and a rental example with real arithmetic. It also covers where the method misleads you, and how it differs from scenario analysis.
TL;DR
- Sensitivity analysis changes one input at a time (price, rent, vacancy, rate, rehab cost, ARV) and records the effect on an output like cash flow, profit or maximum allowable offer (MAO).
- Test realistic ranges, not tiny ones. Sweeping a variable roughly 15% to 25% either side of your base case is a common starting point.
- In a flip, ARV usually moves your MAO more in dollars than rehab cost does. In a rental, financing and vacancy often decide whether cash flow survives.
- One-variable tests can mislead when real-world inputs move together. Add a combined downside case before you commit.
- Our rental, rehab, comps and BRRRR calculators are free and need no sign-up, so you can rerun a deal with different inputs in seconds.
Table of Contents
- What sensitivity analysis means for an investor
- Why it matters before you make an offer
- Which assumptions to test
- How to run a sensitivity analysis, step by step
- Worked example 1: a flip and its maximum allowable offer
- Worked example 2: a rental’s monthly cash flow
- Sensitivity analysis vs. scenario analysis
- Where sensitivity analysis misleads you
- Our perspective: test the number you are proudest of
- Run your own sensitivity tests
- FAQ
- Sources
What sensitivity analysis means for an investor
Sensitivity analysis determines how different values of one input affect an output, given a fixed set of other assumptions. Rockstep’s explainer frames it as modeling changes in assumptions and observing the effect on net operating income (NOI), cash-on-cash return and IRR. Westwood Net Lease lists typical inputs you can change: price, hold period, sale cap rate, vacancy, interest rate and debt yield. The outputs you watch include profit, debt service and cash flow.
Think of a recipe. Your deal model is the recipe, and the inputs are ingredients. Sensitivity analysis asks what happens to the meal if the butter costs 20% more, or the oven runs cooler. You learn which ingredient matters most before you shop.
Your deal model has a base case: the numbers you believe today. Sensitivity analysis does not replace that base case. It tests how fragile it is.
Why it matters before you make an offer
Most bad deals do not fail because of one dramatic event. They fail because a handful of ordinary estimates were each a little optimistic. An ARV that is 5% high, a rehab budget that is 20% low and a rate that is a point higher can wipe out a margin that looked comfortable on paper.
The method helps you in four practical ways, all of which Rockstep names: stress-testing assumptions, uncovering risks, strengthening negotiations and preparing for market swings.
- You find the inputs that drive the result. MaxLife’s course material suggests that identifying the variables with the biggest effect on returns tells you where to focus due diligence. If ARV swings your profit the most, you spend your time on comps, not on paint colors.
- You set a walk-away line. If your profit disappears when rehab runs 25% over, you know your cushion and can price it into your offer.
- You negotiate with evidence. “At this price, one more month of vacancy erases my cash flow” is a stronger argument than “it feels high.”
- You size your reserves. The test tells you how much cash you need to survive a bad stretch.
The same logic is used at institutional scale. A Wharton real estate report on a residential land recapitalization used sensitivity analysis to test interest-rate spread assumptions and show how net present value changed with each spread. Your deals are smaller, but the thinking is identical.
Which assumptions to test
Test the inputs that are both uncertain and powerful. For most investors that means the following.
Fix-and-flip and wholesale deals
- ARV (after-repair value). The most uncertain number in a flip, because it is an estimate of a future sale price drawn from comparable sales. Test it against a tighter and a wider set of comps. Our comps analyzer helps you see how the number moves when you drop your weakest comparable.
- Rehab cost. Test the total and the big line items: roof, HVAC, foundation, kitchen. Our rehab cost calculator lets you change scope and see the total respond.
- Holding time. Each extra month adds interest, taxes, insurance and utilities.
- Purchase price and MAO. The output you are usually solving for.
Rental and BRRRR deals
- Rent. Verify it against current comparables rather than a seller’s number.
- Vacancy and turnover. A single extra empty month is roughly an 8% hit to annual rent.
- Interest rate and loan size. Debt service is the largest fixed cost in most leveraged rentals.
- Operating expenses. Ryan Nelson’s rental cash-flow guidance says to test property taxes after purchase, landlord insurance, maintenance, capital-expenditure reserves, management and utilities, rather than relying on the seller’s expense figures.
- Appraised value and refinance terms (BRRRR). If the appraisal comes in low, you leave less cash in the deal than planned. Our BRRRR calculator models the refinance step.
A UK-focused property modeling guide lists a similar set of inputs: exit yield, rent growth, void periods, construction costs, interest rate and purchase price. The labels change by market, the idea does not.
How to run a sensitivity analysis, step by step
- Build the base case. Enter your best estimates for every input and record the output you care about: monthly cash flow, total profit, MAO or cash-on-cash return.
- Choose the inputs to test. Pick four to six. More than that and the results become noise.
- Set a realistic range for each. The process typically involves sweeping a variable across a range, for example plus or minus 15% to 25% from the base case, while holding everything else constant. A UK guide makes the related point that you should use realistic ranges, not tiny ones that make the deal look safe.
- Change one variable at a time. Westwood Net Lease recommends this for clean numbers. If you change three things at once, you cannot tell which one did the damage.
- Record the output for each change. A simple table is enough.
- Rank the inputs by impact. The input that moves your result most is the one to verify hardest.
- Decide what the results mean. Set your own rule in advance, for example “I need at least $150 a month of cash flow after the downside case” or “I need profit above zero if ARV drops 5%.”
In a spreadsheet, a two-way data table can show two inputs against one output. In a calculator, you simply rerun the deal with new inputs. Either works, as long as you keep the base case intact.
Worked example 1: a flip and its maximum allowable offer
This example is hypothetical, built to show the arithmetic. Suppose you use the common 70% rule for MAO: MAO equals 70% of ARV minus rehab cost. Your base case is an ARV of $250,000 and a rehab budget of $40,000.
Base MAO: ($250,000 × 0.70) − $40,000 = $135,000.
Now test each input on its own, then together.
| Scenario | ARV | Rehab cost | MAO | Change from base |
|---|---|---|---|---|
| Base case | $250,000 | $40,000 | $135,000 | None |
| ARV 5% lower | $237,500 | $40,000 | $126,250 | −$8,750 |
| ARV 10% lower | $225,000 | $40,000 | $117,500 | −$17,500 |
| Rehab 20% higher | $250,000 | $48,000 | $127,000 | −$8,000 |
| Rehab 30% higher | $250,000 | $52,000 | $123,000 | −$12,000 |
| ARV 10% lower and rehab 20% higher | $225,000 | $48,000 | $109,500 | −$25,500 |
Three lessons come out of this table.
ARV carries the most weight. A 10% ARV miss costs you $17,500 of offer room, more than a 30% rehab overrun. Every dollar of ARV error moves MAO by 70 cents, and ARV errors are large in dollar terms because the base number is large. So the most valuable hour you spend is on comps. Pull recent sales of similar size, condition and location, and see how the ARV changes when you remove the most generous one.
Rehab errors hurt dollar for dollar. Each extra rehab dollar lowers MAO by a full dollar. That makes scope creep and unknown conditions expensive. A rehab estimate built from line items is easier to stress than one built from a square-foot guess.
The combined case is the one that bites. The last row is not a catastrophe. A 10% ARV miss and a 20% rehab overrun are ordinary outcomes on a tough project. If your actual offer sits above $109,500, you are betting that neither will happen.
You could now ask the question a lender or partner would: if I buy at the base MAO of $135,000 and the combined case occurs, how much of my margin is left? That is the practical use of the table. It turns “I think the deal works” into “the deal survives this much error.”
Answering how to apply this to an ARV or a rehab estimate, the short version is to treat each as a range rather than a point. Build a low, expected and high ARV from your comps, and a low, expected and high rehab from your scope, then check MAO at the weak end of both. If the deal still clears your minimum profit at those values, your offer has real margin.

Worked example 2: a rental’s monthly cash flow
Again this is a hypothetical. A $200,000 rental with 20% down means a $160,000 loan. At 7% over 30 years the principal and interest payment is about $1,064 a month. Rent is $2,100, vacancy is 5% ($105), and other operating costs (taxes, insurance, maintenance, capital reserves, management) total $700 a month.
Base NOI: $2,100 − $105 − $700 = $1,295. Base cash flow: $1,295 − $1,064 = about $231 a month.
| Scenario | Change | Monthly cash flow (approx.) |
|---|---|---|
| Base case | None | $231 |
| Interest rate 8% | Payment rises to about $1,174 | $121 |
| Vacancy 10% | Vacancy cost $210 | $126 |
| Rent 5% lower | Rent $1,995 | $131 |
| Operating costs 15% higher | $805 a month | $126 |
| Rate 8%, vacancy 10%, costs 15% higher | All three | −$89 |
Each single change leaves the deal positive but thin, cutting cash flow roughly in half. The combined case turns it negative. That is what a sensitivity table is for: this property works only if several things go right, and the margin is $231, not comfortable.
What do you do with that? Options include negotiating the price down, putting more money down, finding a lower rate, or passing. You can rerun these numbers in our rental property calculator, and our guide on how to analyze a rental property explains cash flow, cap rate and the 1% rule behind the inputs. For a deeper look at a downside test built around rentals, see our rental stress test article, and for the reserve side, our piece on CapEx reserves and cash flow.
If financing is your biggest swing factor, our investment property financing calculator shows how rate, down payment and term change your payment.
Sensitivity analysis vs. scenario analysis
The two are often confused, and both belong in your process.
- Sensitivity analysis isolates one variable at a time. It answers: how much does this single input matter?
- Scenario analysis changes several variables together to model a coherent environment. Devon Coombs’ course gives a bear case as an example, where lower rent growth, weaker occupancy and higher exit cap rates appear together, such as in a recession.
In our rental example, the first five rows are sensitivity tests and the last row is a small scenario. Use sensitivity analysis to rank your inputs, then scenario analysis to see how a realistic bad stretch plays out. For rare, severe events, the same source recommends scenario analysis over independent variable swings, because a disaster rarely changes just one number.
Where sensitivity analysis misleads you
The method is simple, which makes it easy to misuse. Watch for these problems.
Inputs rarely move alone. In the real-estate-finance text by Linneman and Kirsch, the authors warn that one-variable tests can be meaningless when a changed variable would realistically move others. A weakening local economy can lower rents, raise vacancy, change expenses and financing, and shift cap rates all at once. Interest rates and cap rates, for instance, often rise together. The fix is to add a combined downside case after your one-at-a-time tests.

Ranges that are too narrow. Testing rent at plus or minus 1% proves nothing. Choose ranges that match the actual uncertainty, and be harsher on the inputs you know least about.
Ranges that are absurd. The opposite error is stacking every disaster at once. Nelson’s view is that a useful downside case reflects ordinary setbacks such as lower rent, extra vacancy, higher insurance, changed loan payments or a major repair, not an implausible pile-up. A downside you would never believe cannot guide a decision.
Bad base numbers. Sensitivity analysis tests your model, not your data. If the base rent is a seller’s claim or the ARV rests on one flattering comp, the table is precise and wrong. Verify the base case first.
Missing risks outside the model. Some property-level risks, such as concentration in one tenant, one market or one lender, do not show up as a single cell in a spreadsheet. A guide to common portfolio risks is a good prompt for assumptions worth stress-testing before you invest.
Our perspective: test the number you are proudest of
We built our calculators around a simple observation: investors rarely lose money on the number they doubt. They lose it on the number they stopped questioning. It is usually the ARV that came from one agent’s quick opinion, the rehab figure from a walkthrough of twenty minutes, or the rent copied from a listing.
So our habit is to take the most reassuring input in the deal and push it first. If your flip only works at the top of your comp range, you do not have a margin, you have a hope. If your rental only cash flows with zero vacancy and no reserves, the same is true.
We also think investors should run the test quickly and often. A sensitivity table that takes an hour gets skipped. One that takes a minute becomes a habit, which is why our free calculators need no sign-up: open one, change a number, see the result, and decide whether the deal deserves more of your time.
— Michael
Run your own sensitivity tests
You can do everything in this guide with free tools. Our free calculators cover ARV and comps, rehab costs, rental cash flow, financing and BRRRR, and none requires an account. Change one input, note the result, and repeat.
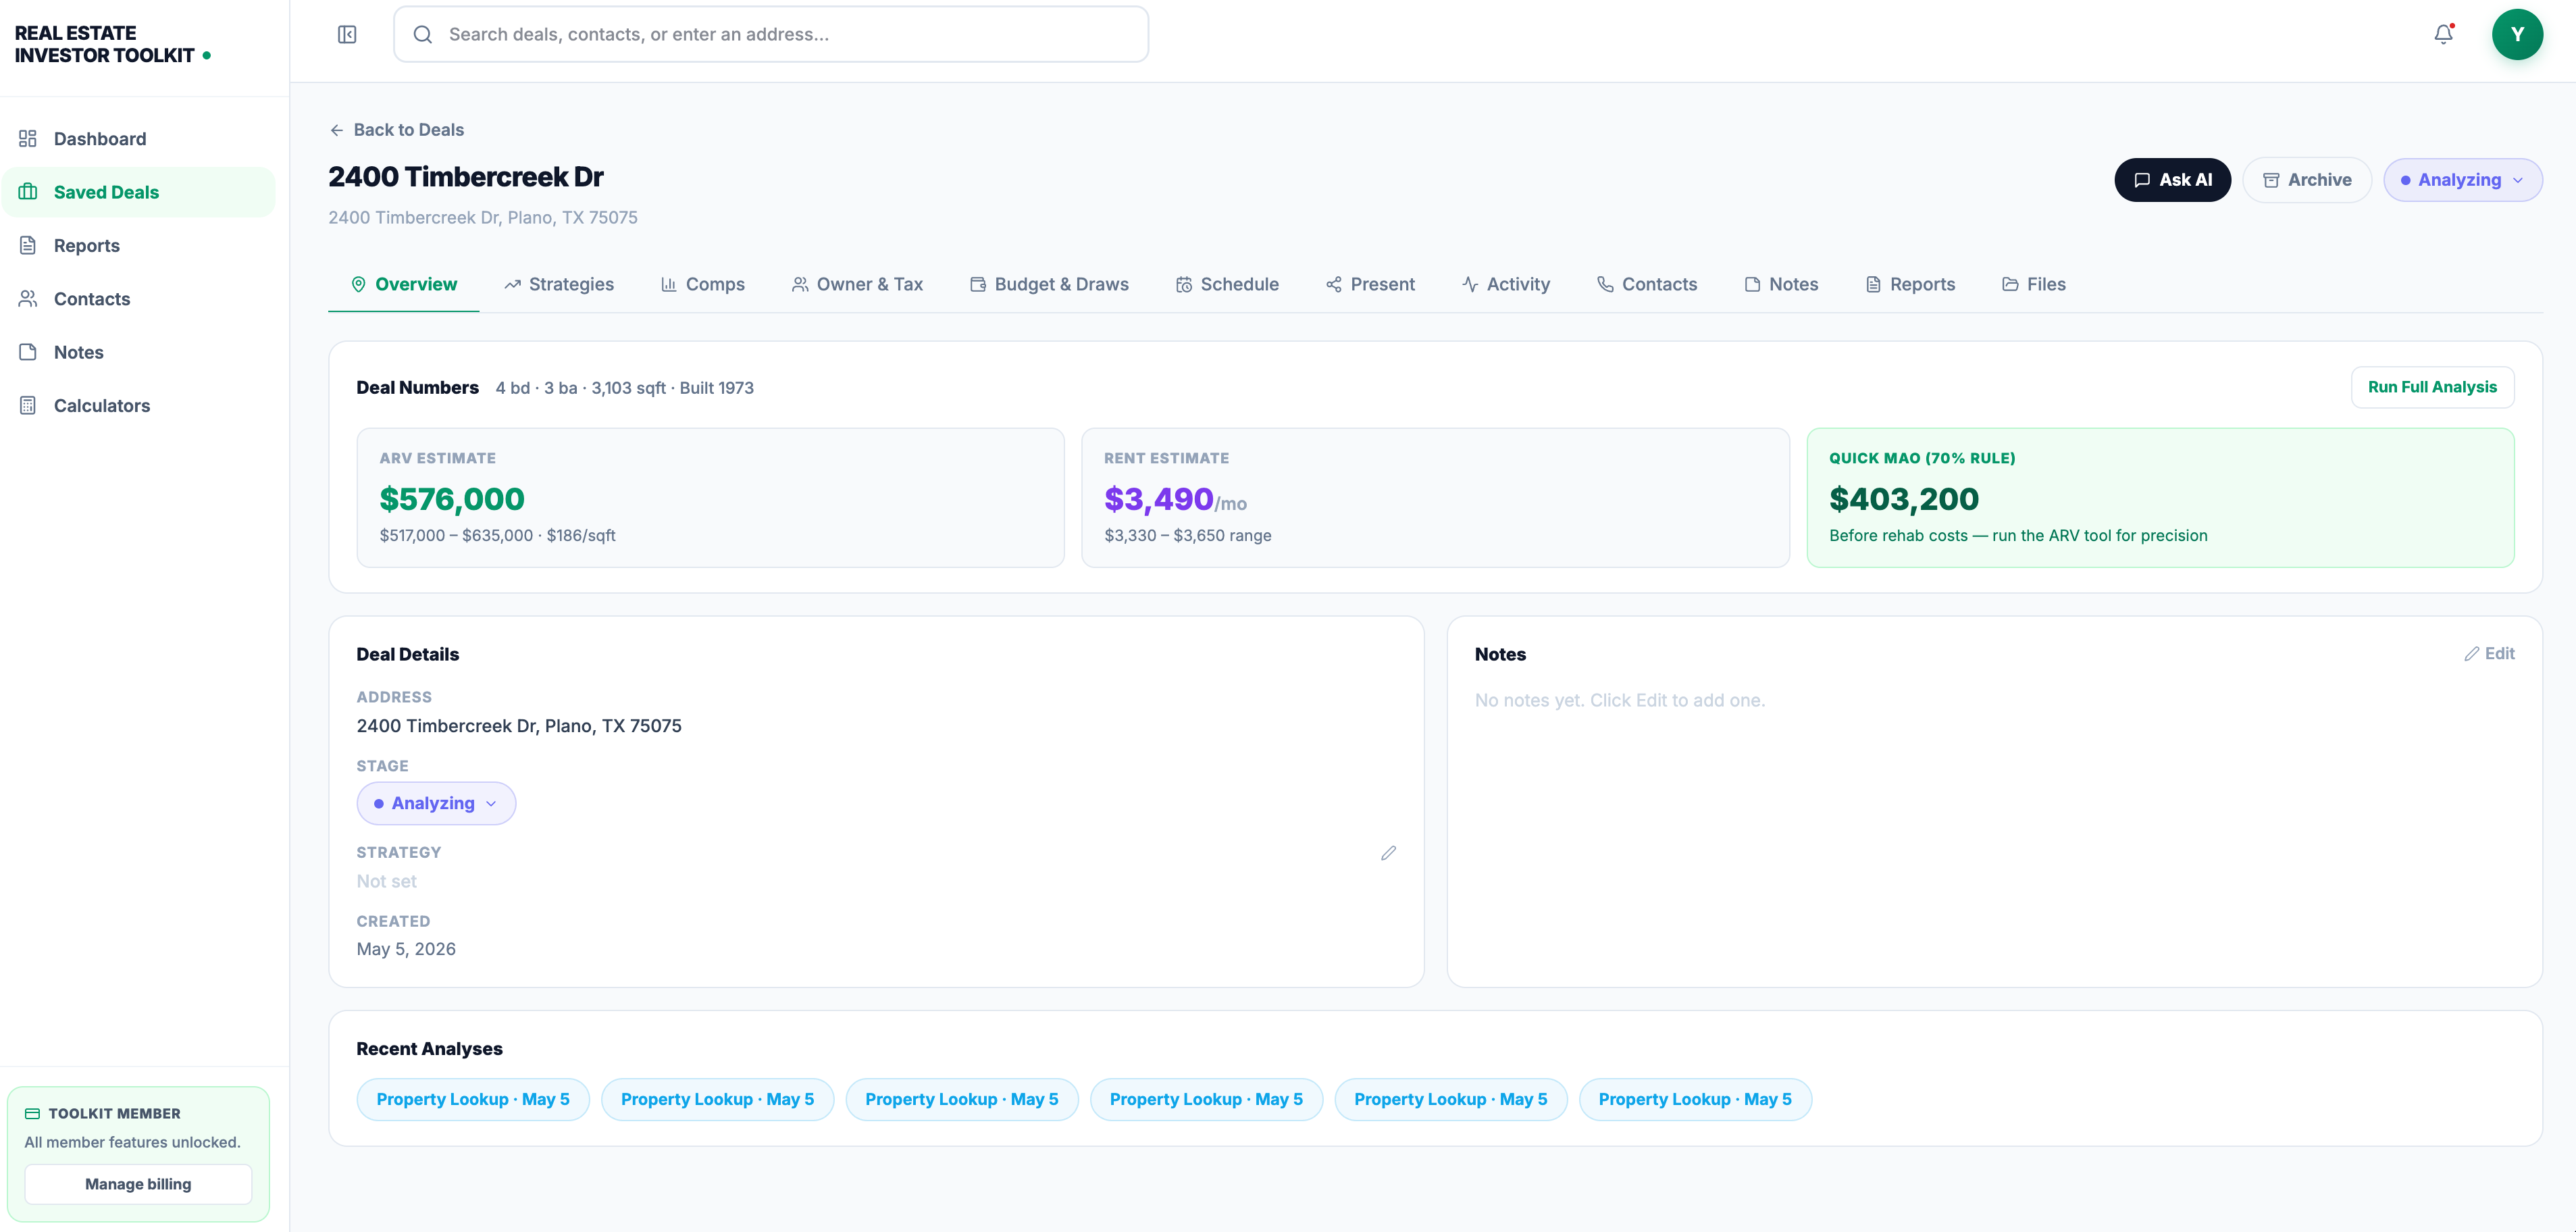
When you are analyzing deals every week, the paid Real Estate Investor Toolkit plan is $39.99 per month. It adds unlimited reports, saved deal pipelines, advanced property data, owner and absentee-owner details, and an AI assistant for deal insights, so you can keep your tested deals in one place. See the details on the pricing page.
FAQ
What is the difference between sensitivity analysis and scenario analysis?
Sensitivity analysis changes one variable at a time to show how much that input matters. Scenario analysis changes several variables together to model a coherent situation, such as a recession with lower rent, higher vacancy and higher cap rates. Most investors use sensitivity analysis first to rank inputs, then scenarios to test realistic bad outcomes.
Why do investors do sensitivity analysis?
They do it to learn which assumptions can break a deal before money is committed. The result tells you where to focus due diligence, how much cash reserve to hold and how far you can negotiate. It also gives you a clear walk-away point instead of a gut feeling.
How wide should my ranges be?
Start with roughly 15% to 25% either side of the base case for uncertain inputs like rehab cost, rent or ARV, a range cited in Devon Coombs’ modeling course. Go wider on inputs you have the least evidence for. Keep the range plausible: ordinary setbacks, not a collection of disasters.
Can I do sensitivity analysis without Excel?
Yes. A spreadsheet data table is one method, but you can also rerun a calculator with a changed input and record the output in a simple table. The discipline matters more than the software: keep a fixed base case, change one input at a time and write down each result.
Sources
- Sensitivity Analysis Is The Tool New Investors Often Overlook, Rockstep
- What Is A Sensitivity Analysis And How Does It Work?, Westwood Net Lease
- Residential Land Recapitalization, Wharton Real Estate
- Sensitivity and Scenario Analysis, MaxLife
- The $1,050 Rental Property Cash-Flow Illusion, Rental Real Estate
- Sensitivity Analysis in Excel for Property Deals
- How Do You Forecast Real Estate Cash Flows?, Devon Coombs
- Chapter 6, Financial Modeling, Real Estate Finance and Investments
- Common Risks to Your Real Estate Portfolio