Rental Property Cash Flow: How to Calculate and Improve It

Rental property cash flow equals effective rental income minus operating expenses minus annual debt service. A deal worth underwriting typically clears at least $200 per unit per month after all expenses, or delivers a cash-on-cash return of 6–10% on your total invested capital. Lenders apply a parallel test: the Debt Service Coverage Ratio (DSCR), calculated as NOI divided by annual debt service, with most investment property lenders requiring 1.20–1.25x to approve a loan. One number investors routinely leave out of their projections is the CapEx reserve, the annual budget for roof replacements, HVAC systems, and appliances. Skip it, and a property that looks profitable on paper turns into a cash drain the first time a major system fails. The Real Estate Investor Toolkit Rental Property Calculator runs all of these metrics together so you can validate assumptions before you make an offer.
Table of Contents
- How do you calculate rental property cash flow step by step?
- What should you include in your income and expense checklist?
- How do cash flow, NOI, cap rate, and cash-on-cash differ?
- What are the investor rules of thumb, and when do they fail?
- How can you improve cash flow on a rental property?
- How do you run the numbers using Real Estate Investor Toolkit calculators?
- What are the most common underwriting red flags?
- Key Takeaways
- The metric most investors underweight
- Run your deal numbers for free with Real Estate Investor Toolkit
- Useful sources for deeper reading
How do you calculate rental property cash flow step by step?
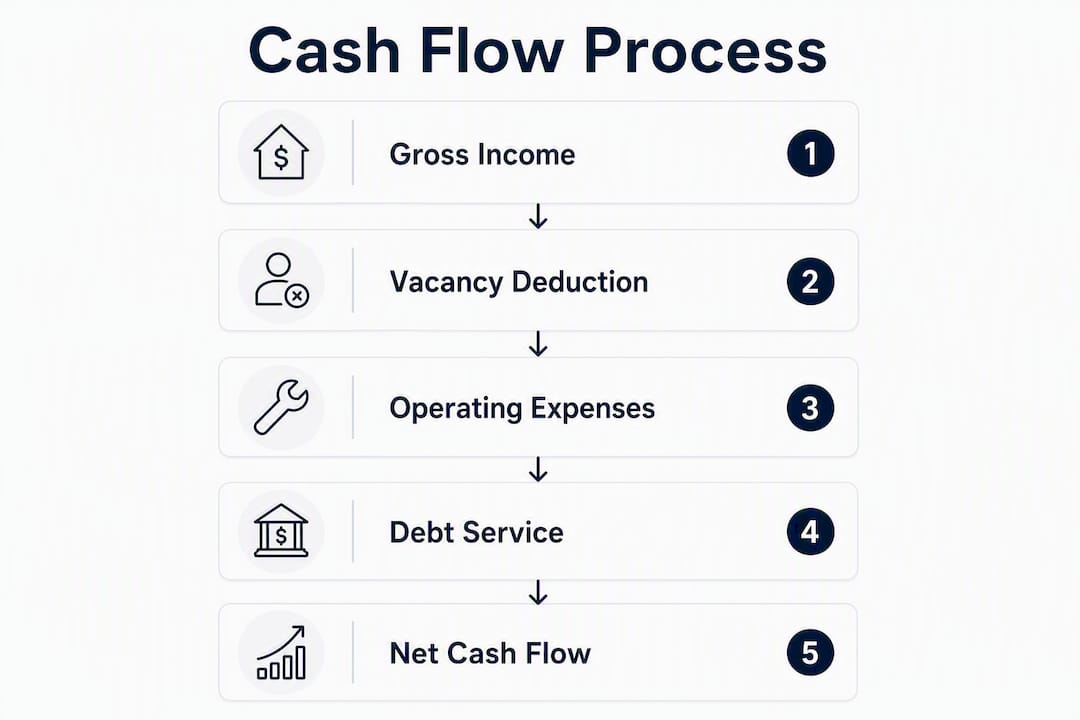
Follow these five steps in order. Each one feeds the next, and skipping any of them produces a number you cannot trust.
-
Estimate gross rental income. Add monthly rent across all units plus any other property income: parking fees, laundry, storage, or pet fees. Multiply by 12 for an annual figure.
-
Subtract vacancy to get effective gross income. At $1,800 in monthly rent, a 5% vacancy allowance costs $90 per month, or $1,080 per year. A realistic vacancy rate for most U.S. markets falls between 3% and 8%. Use local data when you have it; use 5–8% when you don’t.
-
Subtract operating expenses to find Net Operating Income (NOI). NOI equals effective gross income minus all operating expenses, but it excludes CapEx, debt service, and income taxes. Operating expenses include property taxes, insurance, property management, maintenance, utilities you pay, HOA dues, and any recurring professional fees.
-
Subtract annual debt service to find annual cash flow. Annual debt service is your total mortgage payments for the year, principal plus interest. Annual cash flow = NOI minus annual debt service. Divide by 12 for the monthly figure.
-
Divide annual cash flow by total cash invested for cash-on-cash return. Total cash invested includes your down payment, closing costs, and any upfront repairs. Cash-on-cash return = annual pre-tax cash flow ÷ total cash invested, expressed as a percentage.
The core formulas at a glance
- Cash-on-cash return — = Annual cash flow ÷ Total cash invested × 100
Quick numeric example
A single-family rental generates $2,000/month in gross rent. With 5% vacancy ($100/month), effective gross income is $1,900/month, or $22,800/year. Operating expenses total $7,200/year (taxes, insurance, management, maintenance). NOI = $22,800 − $7,200 = $15,600. Annual debt service on a mortgage at typical market rates over 30 years can run into the low tens of thousands of dollars. Annual cash flow = $15,600 − $12,780 = $2,820, or $235/month. With $45,000 invested (down payment plus closing costs), cash-on-cash return = $2,820 ÷ $45,000 = 6.3%.
Inputs you need to run this in a calculator: monthly rent, other income, vacancy %, property tax, insurance, maintenance budget, management fee %, utilities you pay, HOA, CapEx reserve %, mortgage rate, loan term, loan-to-value ratio, down payment, and closing costs.
What should you include in your income and expense checklist?
| Income Items | Expense Items |
|---|---|
| Base monthly rent | Property taxes |
| Parking / garage fees | Homeowner’s insurance |
| Laundry income | Property management (8–10% of rent) |
| Storage unit rent | Maintenance and repairs (1% of value or 5% of rent) |
| Pet fees | CapEx reserve (5% of rent or $1,000–$2,000/unit/year) |
| Short-term rental premium | Vacancy allowance (3–8% of gross rent) |
| Utility reimbursements | Utilities owner pays (water, trash, gas) |
| Late fees | HOA dues |
| Move-in fees | Landscaping / snow removal |
| Accounting and legal fees | |
| Turnover / re-leasing costs |

Conservative underwriting often reserves 23–25% of gross rent for vacancy, maintenance, CapEx, and management combined before the mortgage is even factored in. That figure surprises many first-time landlords who budget only for taxes and insurance.
The items investors most frequently omit are CapEx reserves, turnover costs, and legal or eviction fees. Turnover alone, including cleaning, paint, and a week or two of vacancy between tenants, can cost several thousand dollars per unit per occurrence. Eviction proceedings in many states add significant legal fees and lost rent.
Pro Tip: Size your CapEx reserve by the age of the property’s major systems. A roof with five years of life left needs a larger annual reserve than one recently replaced. A practical starting point: budget a few thousand dollars per unit per year for properties built before 2000, and revisit that number after your first inspection report. Treating CapEx as a mandatory recurring expense rather than an occasional surprise is one of the clearest separators between investors who scale and those who stall.
How do cash flow, NOI, cap rate, and cash-on-cash differ?
Each metric answers a different question. Using only one of them is like navigating with half a map.
| Metric | What goes into it | What it tells you | Best used for |
|---|---|---|---|
| NOI | Effective income − operating expenses | Property-level operating profit | Comparing properties regardless of financing |
| Cap rate | NOI ÷ Purchase price | Unlevered return on full price | Valuing a property vs. market peers |
| Cash-on-cash | Annual cash flow ÷ Cash invested | Investor-level leveraged return | Measuring your actual return on equity |
| Cash flow | NOI − Debt service | Dollars to your bank account | Budgeting and lender DSCR checks |
Cap rate evaluates property return on the full purchase price, while cash-on-cash measures the investor’s return after leverage. The same property can show a 6% cap rate and a 9% cash-on-cash return when financed at favorable terms, or a 6% cap rate and a 2% cash-on-cash when rates are high. Financing changes the investor’s outcome dramatically while leaving the cap rate unchanged.
Consider a property priced at $300,000 with an NOI of $18,000. Cap rate = $18,000 ÷ $300,000 = 6%. If you put $75,000 down and carry $225,000 at 7% (annual debt service ≈ $17,970), annual cash flow is only $30. Cash-on-cash ≈ 0.04%. The cap rate looked reasonable; the leveraged return is nearly zero. NOI also serves as the basis for property valuation, so a strong NOI per unit relative to market peers signals both operational health and pricing power.
The DSCR check sits alongside these metrics at the lender level: DSCR = NOI ÷ Annual debt service. In the example above, $18,000 ÷ $17,970 = 1.002, well below the 1.20–1.25 threshold most lenders require.
What are the investor rules of thumb, and when do they fail?
Quick screening heuristics save time. They are not underwriting.
- 50% rule: Estimate that operating expenses (excluding debt service) will consume 50% of gross rent. What remains is your rough NOI. Useful for a 30-second screen; breaks down in markets with high property taxes or HOA fees.
- 1% rule: Monthly rent should equal at least 1% of the purchase price ($200,000 property → $2,000/month rent). Screens for basic cash flow potential. Rarely achievable in coastal or high-appreciation markets.
- 2% rule: A stricter version of the 1% rule targeting markets with lower appreciation and higher yields. Almost never met in major metros; more relevant in Midwest or secondary markets.
- 75/55 reference: Some lenders and investors use 75% of gross rent as a proxy for effective income after vacancy, or 55% as a rough NOI estimate after expenses. These are shorthand, not substitutes for line-item budgets.
The 50% rule breaks most visibly in two scenarios: properties with very low property taxes (where actual expenses run 35–40% of rent, making the rule too conservative) and properties with high HOA fees or older systems (where expenses exceed 55–60%, making the rule dangerously optimistic). A coastal duplex with a $900,000 purchase price and $4,500/month in combined rent passes the 1% rule at exactly 0.5%, failing immediately. But even a Midwest property that passes the 1% screen can fail conservative underwriting once you add a realistic CapEx reserve and management fee.
A short example: a $150,000 property renting for $1,500/month passes the 1% rule. The 50% rule estimates $750/month in expenses and $750/month in NOI. After a $900/month mortgage payment, cash flow looks like negative $150/month, already a red flag. Add a $75/month CapEx reserve and 5% vacancy ($75/month), and the actual monthly loss is $300. The rule of thumb said “screen further”; the full underwriting says “pass.”
How can you improve cash flow on a rental property?
Tactics ranked from fastest impact to longest runway:
1. Refinance or restructure debt. Dropping your mortgage rate by 0.5% on a $200,000 loan saves roughly $60–$70/month in debt service. Use the Real Estate Investor Toolkit Investment Property Financing Calculator to model rate scenarios and check DSCR before approaching a lender. The trade-off: refinancing costs $3,000–$6,000 in closing costs, so calculate your break-even period.
2. Raise effective rent through value-adds. Adding in-unit laundry, covered parking, or a fenced yard can justify $75–$200/month in rent premium in many markets. The risk is upfront CapEx spend with no guarantee of tenant uptake at the new price point.
3. Challenge your property tax assessment. In many U.S. counties, assessed values lag market corrections, and a formal appeal can reduce annual taxes by hundreds of dollars. The process takes 60–120 days and costs little beyond your time.
4. Renegotiate insurance. Shopping your landlord policy every two years and bundling properties under one carrier often cuts premiums by 10–20%. Raising your deductible from $1,000 to $2,500 also reduces annual cost, though it shifts more risk to you.
5. Reduce vacancy through tenant experience. Lease renewals cost far less than turnovers. Responding to maintenance requests within 24 hours, offering small renewal incentives, and keeping rent increases modest relative to market can extend average tenancy by 12–18 months.
6. Add income streams or convert space. Adding a storage unit, converting a garage to a rentable space, or listing a unit on a short-term rental platform (where local zoning permits) can increase gross income without raising base rent. Zoning compliance is non-negotiable here; short-term rental ordinances vary sharply by city.
Pro Tip: Before spending on a value-add, apply a simple test: divide the total CapEx cost by the monthly rent increase it will generate. If the payback period exceeds 36 months, the project rarely pencils unless it also increases the property’s resale value. Spending $6,000 to add laundry that generates $100/month extra rent = 60-month payback. Spending $3,000 for the same result = 30 months, worth considering.
How do you run the numbers using Real Estate Investor Toolkit calculators?
Here is a full-worked example using three tools in sequence.
Inputs for the example:
- Purchase price: $220,000
- Down payment: 25% ($55,000)
- Closing costs: $4,500
- Monthly rent: $1,950
- Other income (parking): $50/month
- Vacancy: 6%
- Property tax: $2,400/year
- Insurance: $1,200/year
- Management fee: 9% of rent
- Maintenance: 5% of rent
- CapEx reserve: 5% of rent
- HOA: $0
- Mortgage: $165,000 at 7.25%, 30-year fixed
Step 1: Run the Rental Property Calculator.
Enter all income and expense inputs. The tool computes:
- Gross annual income: $24,000
- Vacancy loss (6%): $1,440
- Effective gross income: $22,560
- Operating expenses: $9,396 (taxes, insurance, management, maintenance, CapEx)
- NOI: $13,164
- Annual debt service: $13,524
- Annual cash flow: −$360 (−$30/month)
- Cash-on-cash: −0.6%
At these inputs, the deal does not work. That is exactly what the calculator is for.
Step 2: Run the Investment Property Financing Calculator to test rate sensitivity.
Drop the assumed rate to 6.75% (achievable with a stronger credit profile or a rate buydown). Annual debt service falls to roughly $12,876. Annual cash flow becomes $13,164 − $12,876 = $288/year ($24/month). Still thin, but DSCR = $13,164 ÷ $12,876 = 1.02, below the lender’s 1.20 minimum.
Step 3: Run the BRRRR Calculator if the property needs rehab.
If you buy at $185,000, invest $20,000 in rehab, and the ARV reaches $240,000, a cash-out refinance at 75% LTV returns $180,000, covering most of your acquisition and rehab costs. The rehab cost guide helps you size that $20,000 estimate before you commit.
Sensitivity check: Raise vacancy from 6% to 9% (one extra month vacant per year). Effective income drops by $585/year. At the 6.75% rate scenario, annual cash flow goes from $288 to −$297. A single percentage point of additional vacancy flips a marginal deal negative. Raise the rate back to 7.25% and add the higher vacancy, and annual cash flow is −$945. Small changes in vacancy or interest rate can swing a marginal deal from positive to negative monthly cash flow, which is why sensitivity testing is not optional.
All three calculators are free to use with no sign-up required.
What are the most common underwriting red flags?
- Missing CapEx reserve. The single most common omission. A property with no CapEx line looks profitable until the HVAC fails. Use 5% of rent or $1,000–$2,000/unit/year as a floor.
- Overstated market rents. Using asking rents rather than actual lease comps inflates income. Pull rent comps from local listings and recent leases, not the listing agent’s pro forma.
- Ignoring vacancy and turnover. Even a “fully occupied” property will turn over. Budget 3–8% vacancy plus one month’s rent per turnover for cleaning, paint, and re-leasing.
- Misclassifying debt service as an operating expense. Debt service goes below the NOI line. Mixing it into operating expenses distorts both NOI and cap rate, making the property look worse than it is on an unlevered basis.
- DSCR below 1.20. A property that cash flows for you may still fail lender underwriting. Model DSCR alongside cash-on-cash because a refinance or portfolio loan depends on it.
- Omitting management fees when self-managing. Include a realistic 8–10% management fee even if you plan to self-manage. If you ever hire a manager or sell to another investor, that line item is real.
- No assumptions sheet. Keep a one-page document for each deal that records your rent comp sources, local tax records, insurance quotes, and expense assumptions. It protects you in due diligence and sharpens your underwriting over time.
Before making any offer, run both the investor-level check (cash-on-cash at your target return) and the lender-level check (DSCR at 1.20+). A deal that passes one but fails the other is not ready.
This article provides general educational information about real estate investment analysis. It is not financial, legal, or tax advice. Consult a qualified professional and verify current rules with the IRS or a licensed advisor before making investment decisions.
Key Takeaways
Rental property cash flow depends on NOI minus debt service, and no projection is reliable without a CapEx reserve and a DSCR check alongside the cash-on-cash return.
| Point | Details |
|---|---|
| Core formula | Cash flow = Effective income − Operating expenses − Debt service; divide by 12 for monthly. |
| CapEx is non-negotiable | Budget 5% of rent or $1,000–$2,000/unit/year; omitting it is the most common underwriting error. |
| NOI vs. cash-on-cash | NOI measures property-level performance; cash-on-cash measures your leveraged return on invested capital. |
| DSCR guardrail | Keep DSCR at 1.20 or above; a deal that cash flows for you may still fail lender underwriting below that threshold. |
| Real Estate Investor Toolkit | The free Rental Property Calculator, BRRRR Calculator, and Financing Calculator let you run full underwriting with no sign-up required. |
The metric most investors underweight
Most investors obsess over monthly cash flow and treat it as the verdict on a deal. That instinct is understandable, but it misses something. Monthly cash flow is the number after all your assumptions play out perfectly: rents hold, tenants renew, nothing breaks. The number that actually tells you whether a deal survives contact with reality is DSCR, because it reflects how much cushion your NOI provides against the fixed obligation of debt service.
A property with $30/month in cash flow and a DSCR of 1.02 is not a cash-flowing property. It is a property one bad month away from a negative balance. The investors who build durable portfolios treat DSCR as a floor, not an afterthought, and they size their CapEx reserves before they calculate cash flow, not after.
The other thing worth saying plainly: sensitivity testing is where underwriting actually happens. Plugging in your best-case assumptions and seeing a positive number is not analysis. Running the same deal at 9% vacancy and a rate 0.5% higher, and seeing whether it still works, is analysis. The deals that survive that test are the ones worth pursuing.
Run your deal numbers for free with Real Estate Investor Toolkit
Calculating cash flow accurately means getting every line item right before you commit capital. Real Estate Investor Toolkit gives you three purpose-built calculators to do exactly that, with no account required to get started.
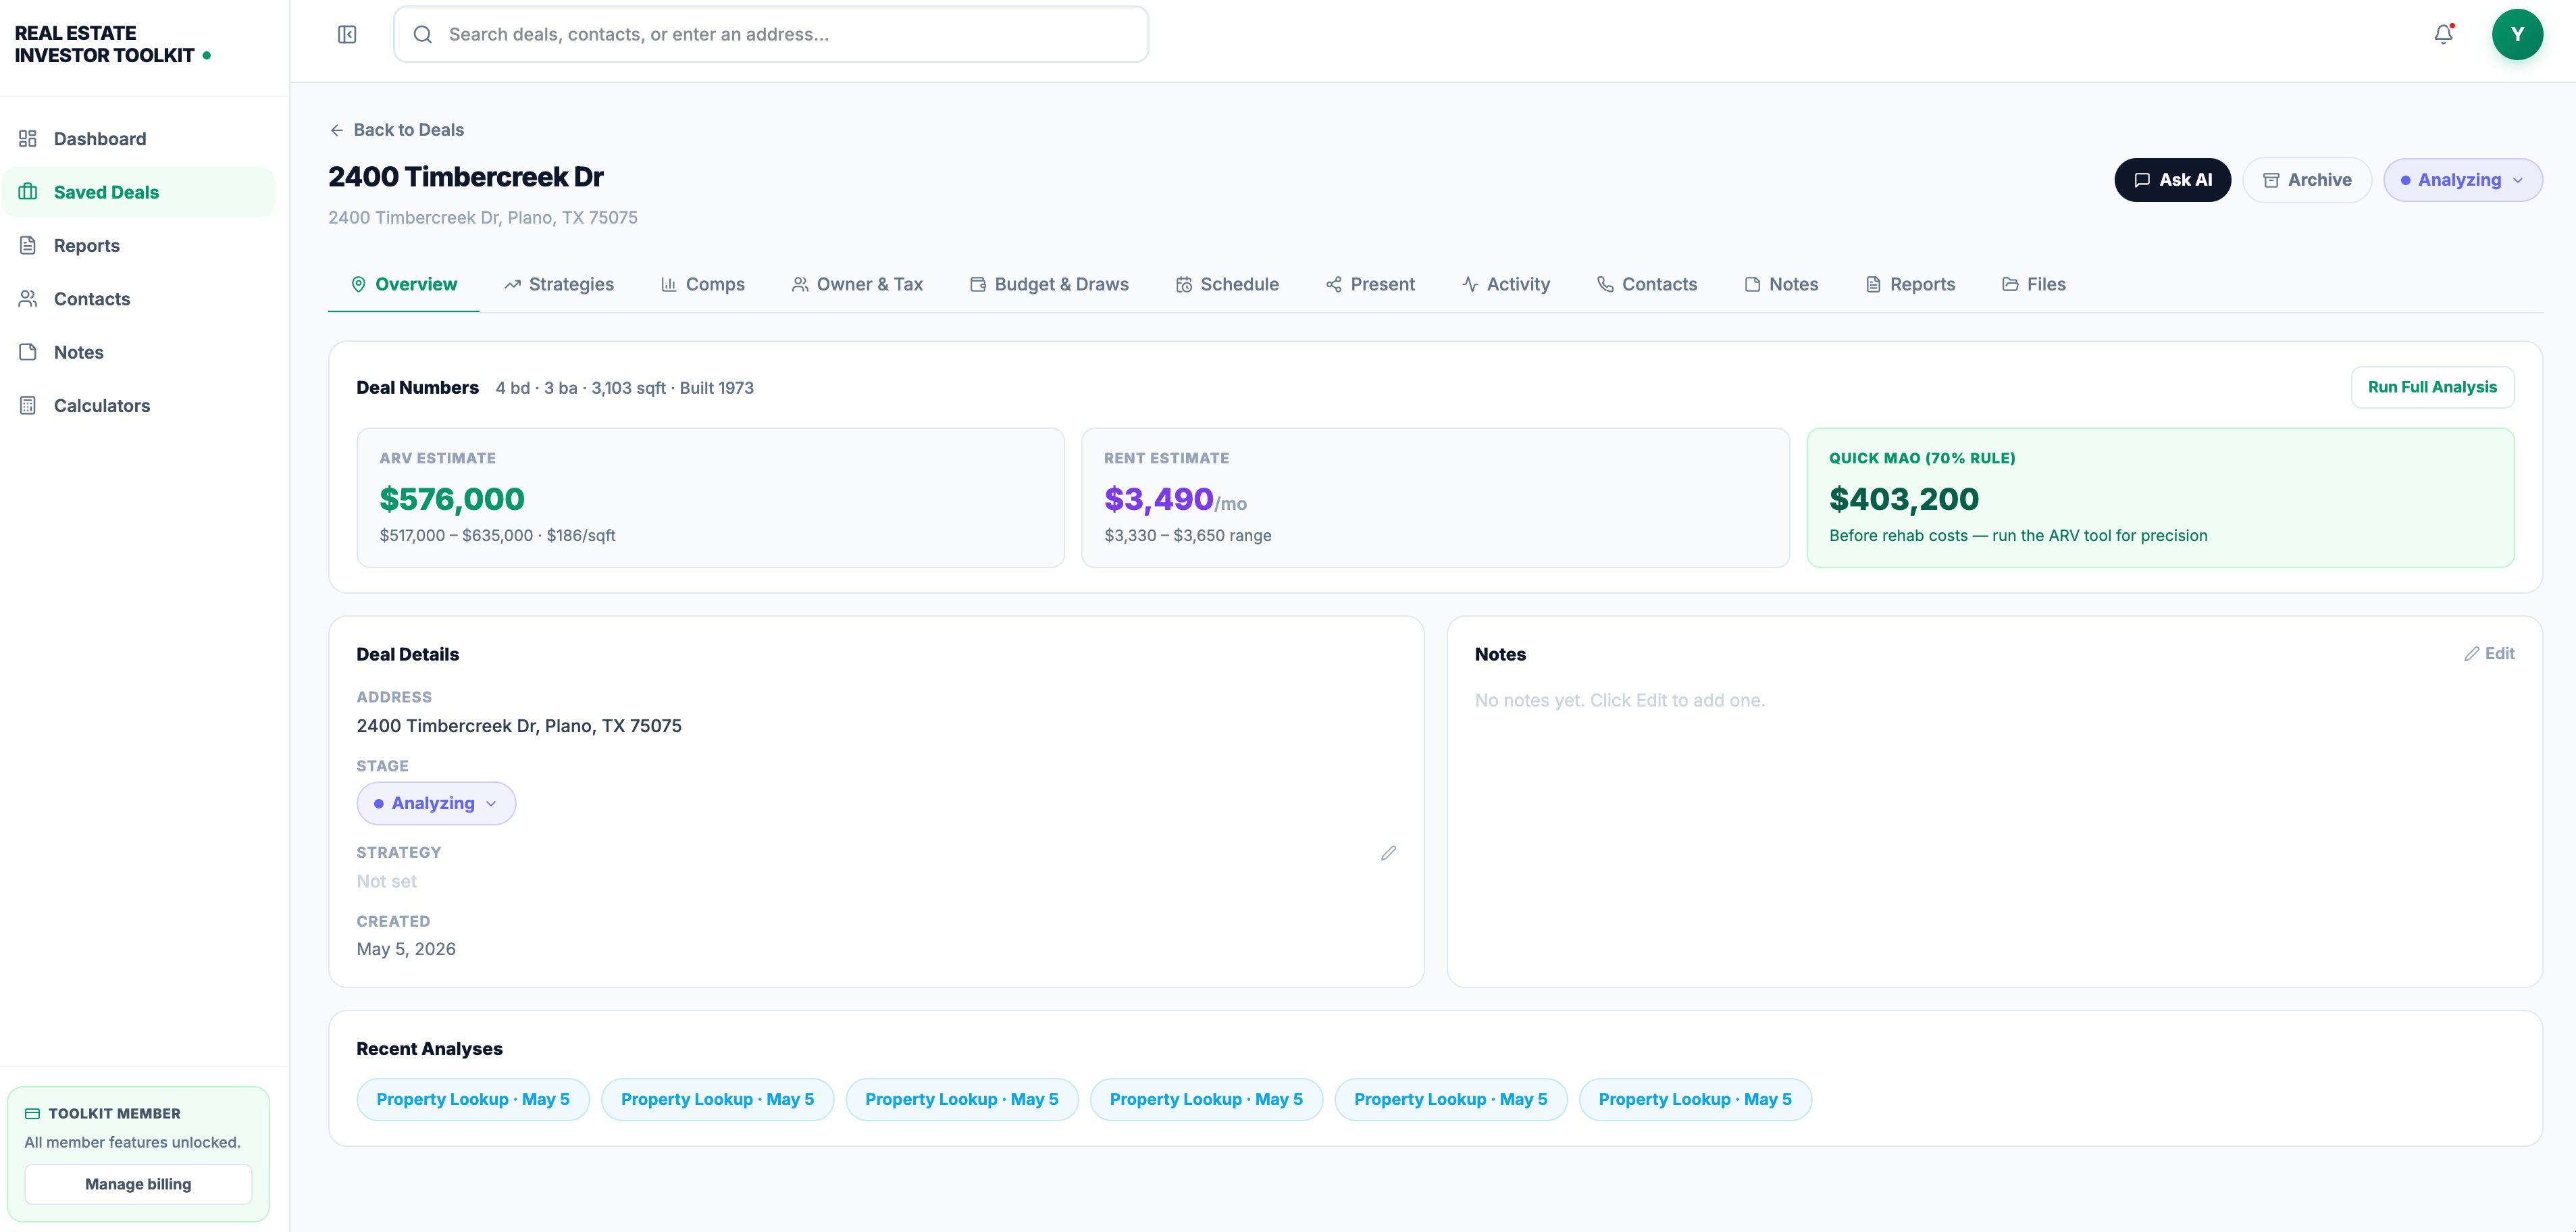
- Rental Property Calculator: Enter your rent, expenses, vacancy, CapEx reserve, and mortgage terms. Get NOI, monthly cash flow, annual cash flow, cash-on-cash return, cap rate, and DSCR in one view.
- BRRRR Calculator: — Model buy-rehab-refinance scenarios, including how a cash-out refinance changes your equity position and ongoing cash flow.
- Investment Property Financing Calculator: Test mortgage rate scenarios, compare loan structures, and check DSCR against lender thresholds before you apply.
Free calculator access requires no sign-up. A paid subscription unlocks saved deal pipelines, advanced property data, owner-occupancy details, and AI-assisted deal insights for investors managing multiple properties. Start with the Rental Property Calculator, plug in the worked example from this article, then run your own deal with conservative assumptions.
Useful sources for deeper reading
- Calculating Net Operating Income (NOI) & Cash Flow — J.P. Morgan: — Authoritative definition of NOI, how it differs from cash flow, and why CapEx and debt service sit below the NOI line.
- Cash-on-Cash Return — Wikipedia: — Clean definition of the cash-on-cash formula and its role as a quick screening metric for income-producing properties.
- Net Operating Income — Adventures in CRE Glossary: — Practical explanation of NOI usage for valuation and peer benchmarking in commercial and residential investment properties.
- Real Estate Investor Toolkit — Rental Property Calculator: Free calculator for running full cash flow, NOI, cap rate, cash-on-cash, and DSCR analysis on any rental deal.
- Real Estate Investor Toolkit — Learning Hub: Frameworks, guides, and underwriting resources for investors who want to go deeper on deal analysis and strategy.
Recommended
- Rental Property Calculator — Cash Flow, Cap Rate & ROI | Real Estate Investor Toolkit
- Investment Property Financing Calculator | Real Estate Investor Toolkit
- Cash-Out Refinance Math: When Pulling Equity Helps and When It Backfires | Mortgage Guides | Real Estate Investor Toolkit
- How to Estimate Rehab Costs on Investment Properties — Real Estate Investing Guide | Real Estate Investor Toolkit