Rent-to-Value Ratio: A Quick Screening Tool for Investors
Rent-to-value ratio (RTV) measures monthly or annual rent against a property’s purchase price to tell you, in seconds, whether a deal is worth a second look. The monthly version divides rent by price; the annual version multiplies that by 12. As a practical verdict: RTV is a screening tool, not a final answer. It tells you whether to keep underwriting, not whether to buy.
The classic benchmark is the 1% rule: monthly rent should equal at least 1% of the purchase price, which works out to a 12% annual rent-to-value ratio. In many markets today, that 1% target has become a stretch goal, and a lot of investors now treat 0.8% monthly as the pragmatic floor worth pursuing further.
Here’s the short version of how to use it:
- Calculate RTV in under a minute using rent and price alone.
- Compare the result against the 1% (strong) or 0.8% (workable) thresholds.
- If the deal clears your threshold, move to full underwriting: cap rate, cash-on-cash, and debt service coverage.
- If it doesn’t clear the bar, don’t waste time modeling expenses. Move on.
Key Takeaways
Rent-to-value ratio works as a fast screening filter, but only cap rate, cash-on-cash return, and DSCR tell you whether a deal actually makes money.
| Point | Details |
|---|---|
| Know the formula | Monthly RTV = rent ÷ price; annual RTV = monthly RTV × 12, or multiply monthly rent by 12 first. |
| Use realistic thresholds | Target 1% monthly (12% annual) when possible, but treat 0.8% as the pragmatic floor in most current markets. |
| Translate to price-to-rent | Divide purchase price by annual rent; a 15x to 20x multiple signals a healthier cash-flow market. |
| Never skip full underwriting | Taxes, insurance, vacancy, and financing can turn a strong RTV deal into a money loser without deeper analysis. |
| Convert RTV into a deal grade | Run passing properties through the Rental Property Calculator and BRRRR Calculator to get NOI, cap rate, and DSCR before making an offer. |
Table of Contents
- How to Calculate the Rent-to-Value Ratio
- What Rent-to-Value Benchmarks Actually Mean
- What the Rent-to-Value Ratio Doesn’t Tell You
- From RTV Screen to Full Underwriting
- Where Higher Rent-to-Value Deals Tend to Show Up
- Turning Rent-to-Value Into a Deal Grade
- Why I Weight RTV Differently by Strategy
- Screen Deals Faster With the Right Calculators
- Frequently Asked Questions
- Sources
How to Calculate the Rent-to-Value Ratio
The monthly formula is simple: monthly rent ÷ purchase price = monthly rent-to-value ratio. The annual version is the same idea scaled up: (monthly rent × 12) ÷ purchase price = annual rent-to-value ratio, or you can just multiply the monthly result by 12. Either framing gets you the same answer, so pick whichever matches how you think about your numbers and stay consistent.
Here’s how that plays out with real listings:
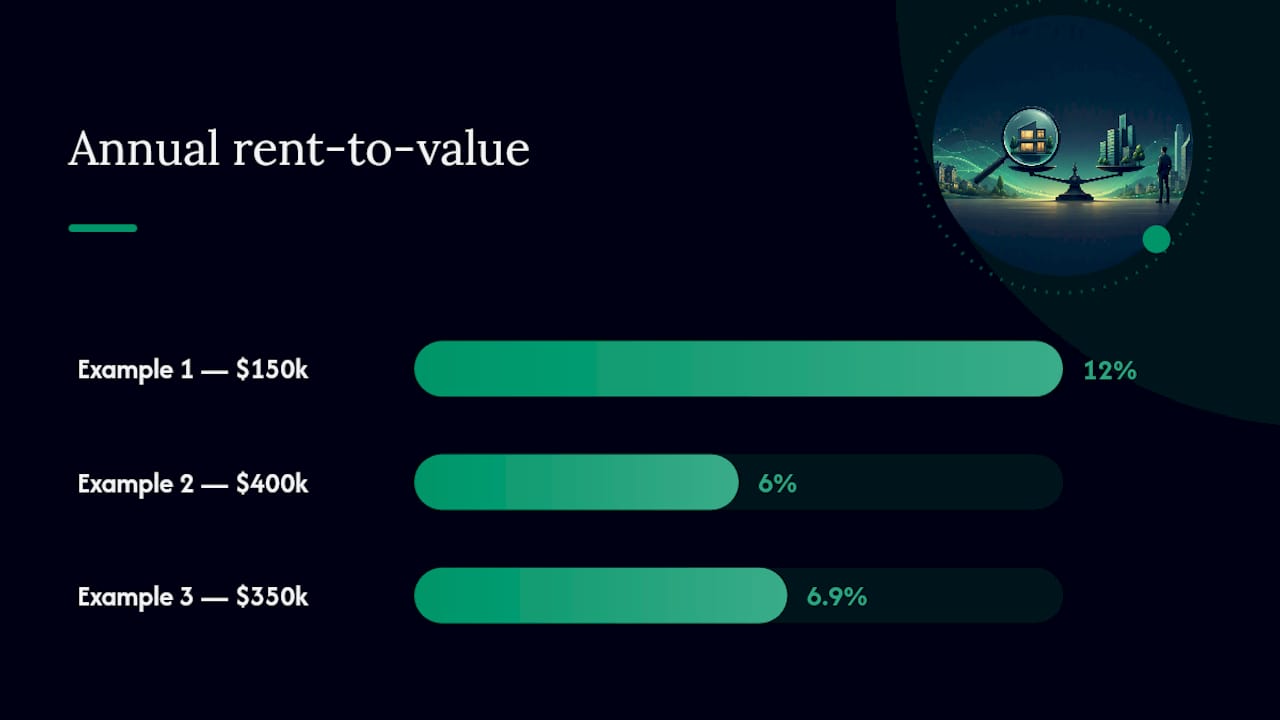
- Example 1 (strong deal): A $150,000 property renting for $1,500 per month. Monthly RTV = $1,500 ÷ $150,000 = 1.0%. Annual RTV = ($1,500 × 12) ÷ $150,000 = 12%. This clears the 1% rule cleanly and earns a closer look.
- Example 2 (weaker deal): A $400,000 property renting for $2,000 per month. Monthly RTV = $2,000 ÷ $400,000 = 0.5%. Annual RTV = 6%. That’s well under even the pragmatic 0.8% threshold, which usually signals a market where investors are betting on appreciation, not monthly cash flow.
- Example 3 (borderline): A $350,000 property renting for $2,000 per month lands at 6.9% annual, calculated as ($2,000 × 12) ÷ $350,000. It falls short of 12% but still beats the weaker example above, worth a deeper underwriting pass before you decide.
Rent-to-value at a glance: A property renting for 1% of its price monthly generates 12% of its price in annual rent, before any expenses come out.
Keep your units consistent. Always use gross rent (not net), and use the actual purchase price, not the list price or your hoped-for offer. Round to one decimal place. Sloppy rounding on RTV can mask the difference between a 0.7% deal and a 0.9% deal, and that gap matters when you’re screening dozens of listings a week.
What Rent-to-Value Benchmarks Actually Mean
The 1% rule remains the most quoted benchmark in rental investing, and for good reason: a property that rents for 1% of its price monthly (12% annually) tends to generate strong gross cash flow relative to its cost. But quoting a benchmark and hitting it in today’s market are two different things.
Many experienced investors now treat 0.8% monthly as the realistic screening threshold, given where financing costs and purchase prices sit in most metros. That’s not a lowering of standards. It’s an acknowledgment that a screening tool has to match current conditions or it stops being useful.
- 0.8% and above: Likely cash-flowing in most financing scenarios; worth full underwriting.
- 0.5% to 0.8%: Mixed signal; cash flow depends heavily on financing terms and expense ratios.
- Below 0.5%: Usually an appreciation-driven market, where investors accept thin or negative cash flow for long-term equity growth.
There’s another way to read the same relationship: price-to-rent multiples. Price-to-rent is the inverse of rent-to-value, calculated as purchase price ÷ annual gross rent. A 15x to 20x multiple is the commonly cited healthy band for rental investing.
Interest rates shift these thresholds in practice, even though they don’t change the math itself. When mortgage rates climb, your monthly payment takes a larger share of rent income, so an RTV that produced solid cash flow at lower rates might barely break even at higher ones.
What the Rent-to-Value Ratio Doesn’t Tell You
RTV is fast precisely because it ignores almost everything except rent and price. That’s also its biggest weakness. A property can post an excellent rent-to-value ratio and still lose money every month once you add in the costs RTV never asked about.
Here’s what gets left out:
- Property taxes, which vary enormously by county and can quietly eat a third of your rent roll.
- Insurance, especially in states with rising premiums tied to climate risk.
- Maintenance and capital expenditures, which older properties demand more of.
- Vacancy, since RTV assumes the unit is rented 100% of the time.
- Financing costs, including interest rate, down payment, and loan term.
- Property management fees, if you’re not self-managing.
Picture a $200,000 duplex renting for $2,000 total monthly. But if property taxes and insurance run $600 a month, maintenance reserves take another $200, and the mortgage payment is $1,100, you’re underwater before you’ve accounted for a single vacant month. The RTV said “keep looking.” The full underwriting says “pass.”
Pro Tip: Before you get attached to a listing, run a rough gut check: assume a 5 to 10% vacancy allowance and set aside another 5 to 10% of rent for maintenance and capex. If the deal still looks tight after those two haircuts, it’s not worth a full underwriting pass.
From RTV Screen to Full Underwriting
A good rent-to-value ratio earns a property the right to be underwritten properly. It doesn’t earn it a purchase agreement. Here’s the sequence that turns a screening pass into a real investment decision.
- Set your triage line. If monthly RTV is at or above 0.8%, proceed. Below that, only continue if you have a specific reason to believe the market’s appreciation potential justifies weaker cash flow.
- Calculate net operating income (NOI). Subtract realistic operating expenses (taxes, insurance, maintenance, vacancy, management) from gross rental income. This is where the blind spots from the last section get accounted for.
- Calculate cap rate. Divide NOI by purchase price. Cap rates vary by market, but many buy-and-hold investors target somewhere in the 5% to 8% range depending on location and property class.
- Calculate cash-on-cash return. Divide annual pre-tax cash flow by total cash invested (down payment, closing costs, and any rehab). This is the number that tells you what your actual money is earning, as opposed to the property’s raw performance.
- Check debt service coverage ratio (DSCR). Divide NOI by annual debt payments. Most lenders want to see 1.20 or higher, and a property that can’t clear 1.0 isn’t covering its own mortgage from rental income.
A few things shift these numbers more than investors expect:
- A larger down payment lowers your monthly mortgage payment, which improves both cash-on-cash return and DSCR, even though it doesn’t touch RTV at all.
- A longer amortization period spreads your principal payments thinner, boosting near-term cash flow at the cost of building equity more slowly.
- Rising interest rates increase your monthly debt service without changing rent or price, meaning the RTV threshold you need to hit for the deal to still work climbs right along with rates.
Run these calculations with a rental property calculator and you’ll see how sensitive cash-on-cash return is to financing terms. Two identical properties with the same RTV can produce completely different investor outcomes depending on how they’re financed. If you want the underlying mechanics spelled out further, our guide on how to analyze a rental property walks through cap rate and the 1% rule side by side.
Where Higher Rent-to-Value Deals Tend to Show Up
Rent-to-value ratios aren’t evenly distributed across the country, and they’re not random either. They follow a fairly predictable pattern once you know what to look for.

Cash-flow metros tend to be secondary and tertiary markets in the Midwest and parts of the South, where purchase prices haven’t run up as fast as rents. Appreciation metros, mostly coastal and gateway cities, usually post lower RTV because buyers are pricing in long-term equity growth rather than immediate yield. Neither is objectively better; they serve different investment strategies.
Property type matters just as much as location:
- Small single-family homes in working-class neighborhoods often post the strongest RTV, since rents track closely with local wages while prices stay comparatively modest.
- Duplexes and small multi-units can outperform single-family on RTV because you’re spreading one purchase price across two or more rent checks.
- Older housing stock in stable, established neighborhoods frequently rents well relative to its lower acquisition cost, though it usually needs closer scrutiny on maintenance and capex.
- ADUs (accessory dwelling units) added to existing lots can post excellent RTV since the land cost is already sunk into the primary structure.
To source these deals, filter MLS listings by price-to-rent ratio where the platform allows it, or reverse-engineer it by pulling comparable rents from local property managers who already know what units are leasing for. Off-market channels and auctions can surface underpriced properties that post stronger RTV than anything sitting on the open market, though you’ll want a market analysis checklist to keep your comps honest. Whatever the source, verify rent comps against actual signed leases, not optimistic listing estimates. A neighborhood’s real rent ceiling is often lower than what a seller’s pro forma claims.
Turning Rent-to-Value Into a Deal Grade
Once a property clears your RTV threshold, the next move is running it through calculators that turn that raw ratio into the metrics that actually decide whether you buy.
- Start with the Rental Property Calculator to convert rent and price into NOI, cap rate, and cash-on-cash return.
- Layer in financing terms using the Investment Property Financing Calculator to see how your specific loan structure affects DSCR and monthly cash flow.
- If you’re planning to force appreciation through renovation, run the numbers through the BRRRR Calculator to see how refinance terms affect your long-term position.
Before you open any of these tools, have your purchase price, estimated rent, expected vacancy rate, rehab budget, property taxes, insurance estimate, and financing terms ready. The more accurate your inputs, the more the output reflects reality instead of a best-case scenario.
If the deal only works under the optimistic number, you haven’t found a deal. You’ve found a hope.*
Why I Weight RTV Differently by Strategy
RTV means something different depending on what you’re building. For a BRRRR deal, I care less about day-one RTV and more about what rent looks like after rehab and refinance. For a flip, RTV barely matters at all.
The trade-off between cash flow and appreciation isn’t a problem to solve. It’s a choice to make deliberately, and it should match the deal, not a rule you read once. Try running a few of your own target properties through the numbers before you commit to either camp.
Screen Deals Faster With the Right Calculators
Running rent-to-value by hand is fine for one listing. It falls apart fast when you’re screening a dozen properties a week and need to know within seconds which ones deserve a full underwriting pass. Real Estate Investor Toolkit’s calculators take you from a raw rent and price input straight to NOI, cap rate, cash-on-cash return, and DSCR, with no sign-up required to run the numbers.
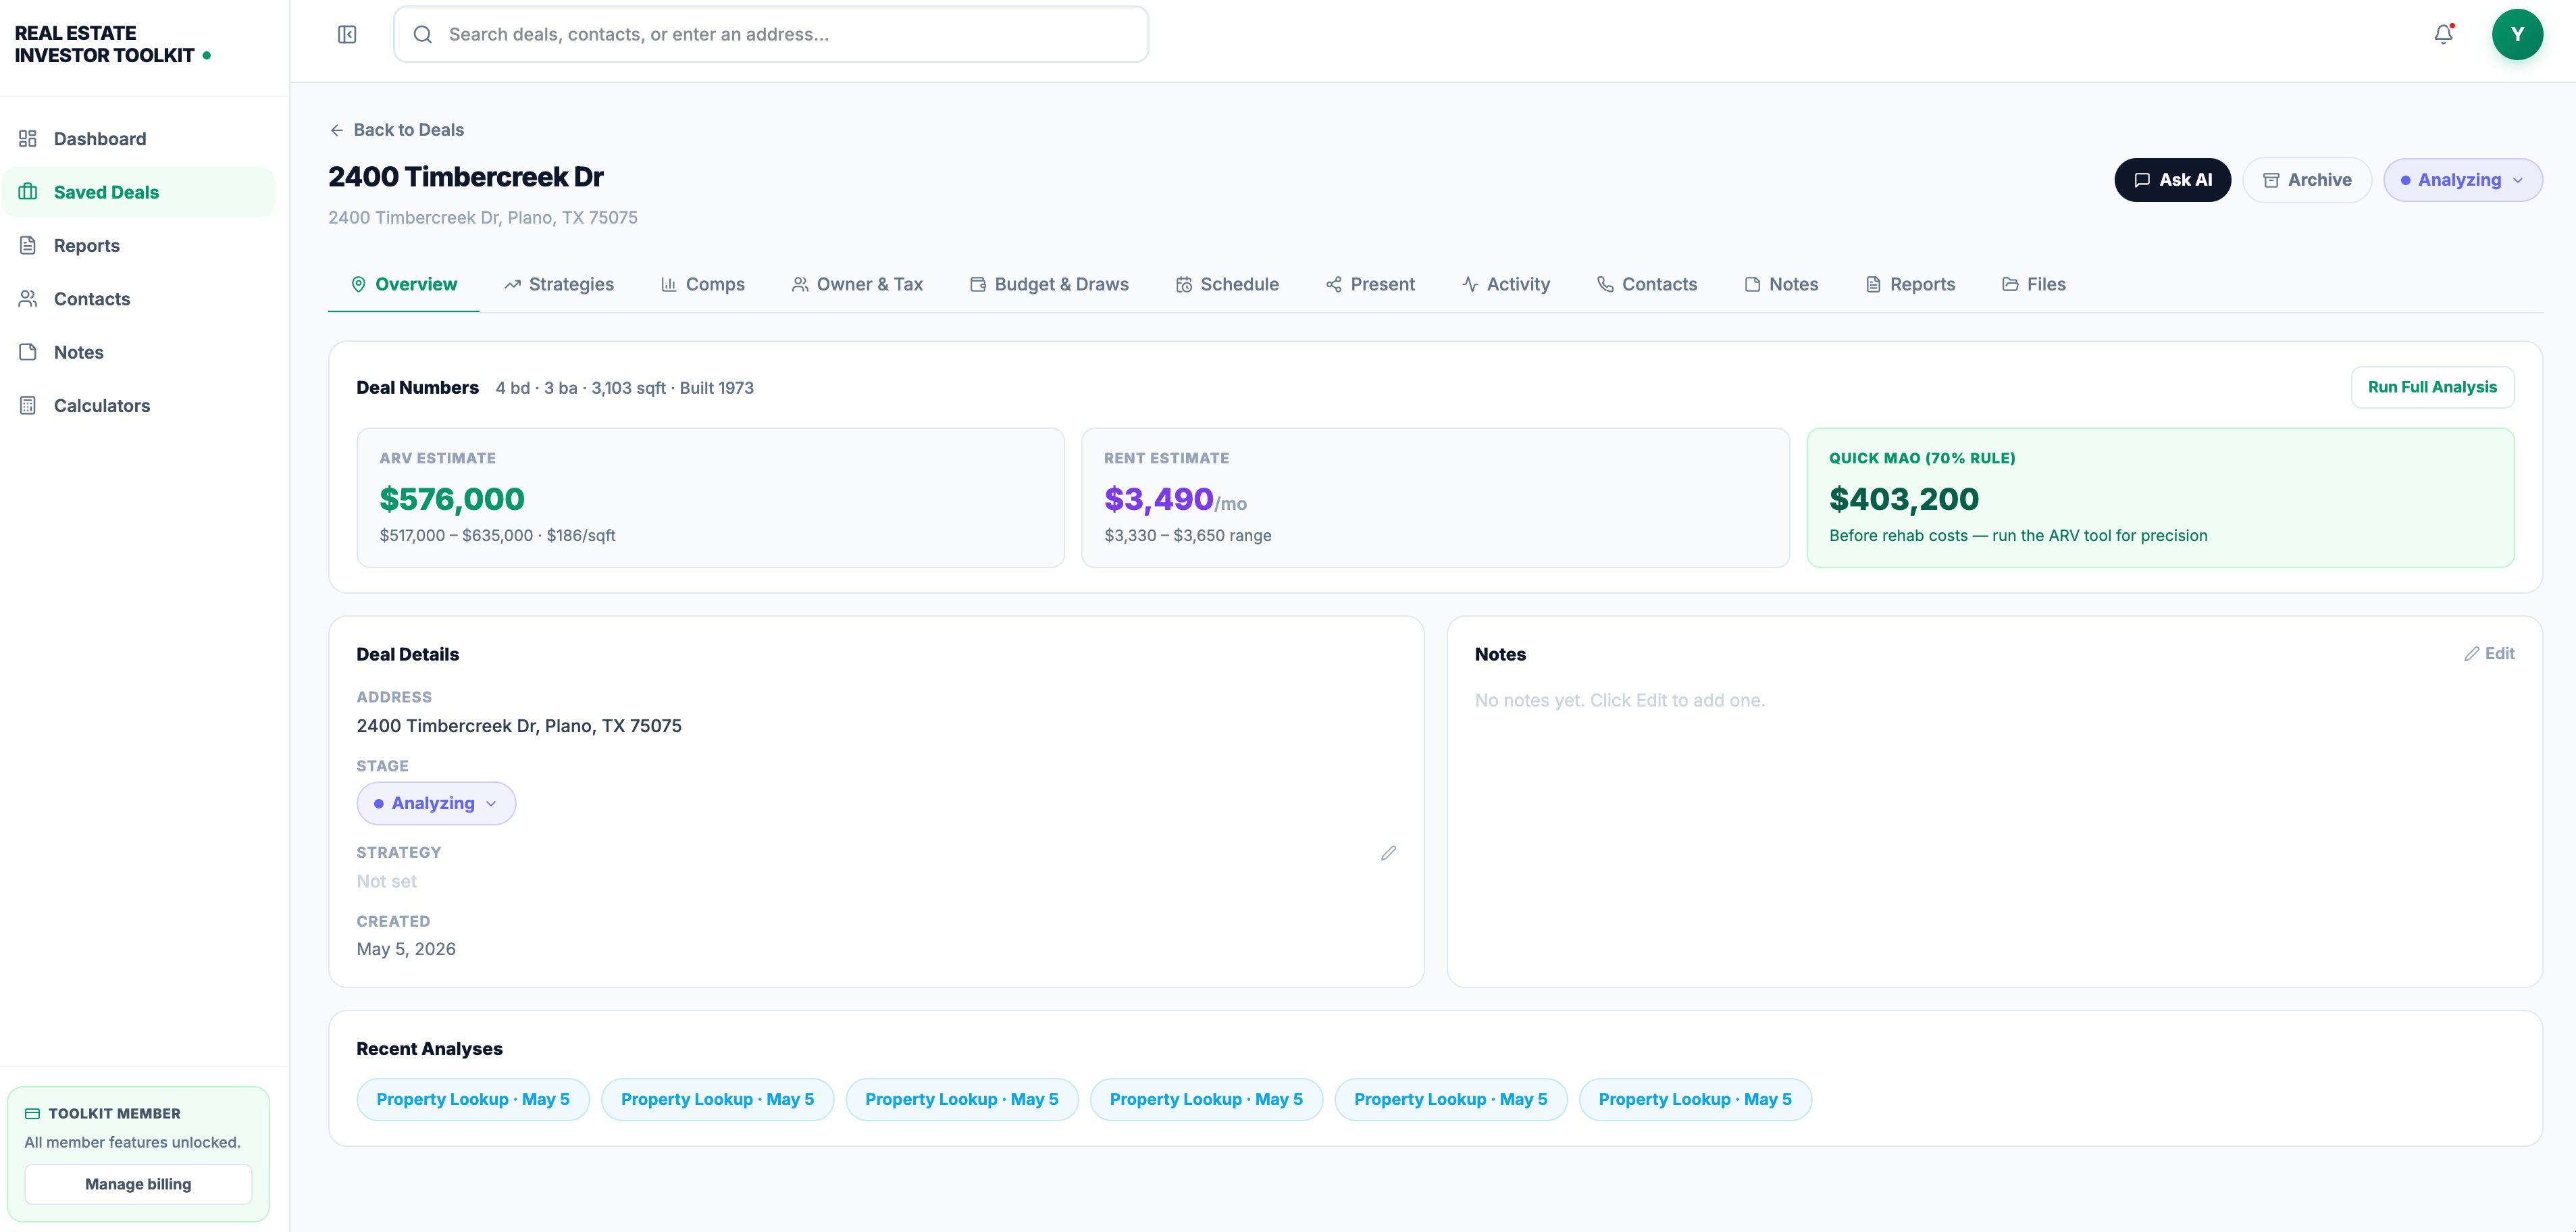
Start with the Rental Property Calculator to turn your RTV screen into a full cash flow picture, then layer in your loan terms with the Investment Property Financing Calculator to see exactly how financing affects your bottom line. If you’re evaluating a value-add or BRRRR opportunity, the BRRRR Calculator models your refinance outcome before you ever make an offer. Save your results as you go, since side-by-side comparisons across several properties are usually what separates a good decision from a rushed one. Browse our full library of investing guides and frameworks for deeper walkthroughs on any metric mentioned here.
Frequently Asked Questions
What is a good rent-to-value ratio?
Is rent-to-value ratio the same as rental yield? They’re closely related. Annual rent-to-value and gross rental yield are calculated the same way (annual rent ÷ price), though “yield” sometimes refers to net figures after expenses, while RTV typically stays gross for quick screening purposes.
Can a property have a good RTV and still be a bad investment? Yes. RTV ignores taxes, insurance, vacancy, maintenance, and financing costs.
How does rent-to-value ratio relate to price-to-rent multiples? They’re inverses. Price-to-rent equals purchase price divided by annual rent, while rent-to-value equals annual rent divided by purchase price.
It works as a benchmark, but it’s harder to hit in many metros given current prices and interest rates.