Rent Increase Assumptions: Model, Validate, and Stress-Test

Defensible rent increase assumptions rest on three inputs: your submarket’s vacancy trend, same-unit rent comps, and the lender limits that cap how far you can project growth. Get all three right and your model survives underwriting review. Miss any one of them and even a well-structured deal can fail a DSCR test or trigger a lender’s alternative-risk requirement.
Here are the guardrails most institutional underwriters apply before accepting a projection:
- Conservative floor: moderate annual rent growth, used when submarket vacancy is rising or supply pipelines are heavy.
- Base case: typical annual growth supported by same-unit comps and a vacancy trend below 7%.
- Aggressive cap: higher annual growth, reserved for tight submarkets with documented job and population growth. Never use this figure beyond Loan Year 4 without lender-approved market evidence.
Before accepting any projection, run these three validation checks:
- Pull the submarket vacancy rate. If it is above 10%, local pricing power is constrained and aggressive assumptions need explicit justification.
- Compare your projected rent to same-unit comps from the past 90 days, not broad asking-rent averages.
- Confirm your growth vector stays within lender guidelines for each loan year (more on Fannie Mae’s specific limits in Section 6).
Key Takeaways
Defensible rent increase assumptions require submarket vacancy validation, same-unit comp support, and strict adherence to lender-year limits on renovation-driven income and recently signed lease rents.
| Point | Details |
|---|---|
| Validate vacancy first | Submarket vacancy below ~5% supports rent increases; above ~10% signals constrained upside. |
| Use same-unit comps | Closed lease data net of concessions is more reliable than broad asking-rent averages for setting growth rates. |
| Respect lender-year limits | Fannie Mae restricts recently signed lease rents to Loan Years 1–2 and discourages above-base projections beyond Loan Year 4. |
| Run three scenarios | Baseline, downside, and severe downside scenarios with a sensitivity table expose the DSCR and IRR tipping points that matter most. |
| Real Estate Investor Toolkit | The rental and BRRRR calculators let you model year-by-year rent growth, stress-test scenarios, and export audit-ready outputs without rebuilding a spreadsheet. |
Table of Contents
- How do rent increase assumptions change NOI, DSCR, and IRR?
- What data sources should you use to validate rent projections?
- How do you build year-by-year rent increase assumptions for underwriting?
- How should you stress-test rent increase assumptions?
- What lender rules and industry norms govern rent projections?
- What are the most common mistakes in rent increase underwriting?
- How do you operationalize rent assumptions with calculators and templates?
- Real Estate Investor Toolkit puts your rent assumptions to work instantly
- Sources
How do rent increase assumptions change NOI, DSCR, and IRR?
The short answer: more than most first-time analysts expect, and the effect compounds.
Net operating income (NOI) is the direct product of effective gross rent minus operating expenses. Small differences in annual rent growth on a multi-unit property can add significant NOI by Year 1 and, compounded over several years, shift stabilized NOI noticeably. The IRR impact of that swing is not trivial on a leveraged deal.
Debt service coverage ratio (DSCR) is equally sensitive.
Several interaction effects modify how rent increases actually flow through to realized income:
- Vacancy and concessions: A 3% rent increase means nothing if you are offering one month free on every renewal. Model effective rent, not face rent.
- Turnover costs: Each unit turnover typically costs 1–2 months of lost rent plus make-ready expenses. High turnover assumptions reduce the net benefit of any rent hike.
- Lease structure: In a gross lease, the landlord absorbs expense growth, so rent increases must outpace operating cost inflation to move NOI. In a net lease, tenants carry more of that burden, making rent growth more directly accretive.
Multimodal machine-learning research confirms that rent variation is driven by nonlinear interactions among property attributes, accessibility, and perceptual factors, not a simple linear trend. That finding has a practical implication for underwriters: a single national growth rate applied uniformly across a portfolio can mask threshold effects at the submarket level where small supply shifts flip pricing power quickly.
What data sources should you use to validate rent projections?
The most reliable inputs come from sources that track actual transaction rents, not just asking prices. Here is how the main sources map to model inputs.
National and submarket indices
Apartment List’s national rent data uses a repeat-transaction methodology, tracking the same units over time. That makes its month-over-month and year-over-year figures more useful for first-year growth inputs than broad asking-rent snapshots, which overstate achievable rents when concessions are common. Apartment List also publishes vacancy and time-on-market indexes that serve as submarket diagnostics.
Yardi Matrix’s 2026 special report projected national multifamily rent growth of approximately 1.4% for 2026, with pronounced divergence across markets driven by localized supply pressure. That figure is a useful baseline for conservative scenario modeling, not a target.
CoStar Group data, reported through Apartments.com, showed essentially flat monthly apartment rent growth for July 2026 (approximately +0.03% month-over-month) and modest annual growth of about +1.0% year-over-year, with broad regional differences tied to local supply. That kind of national-level muting can hide strong submarkets and weak ones simultaneously.
Local and submarket sources
- Chandan Economics’ multifamily updates — track metro-level breadth of rent increases month by month, useful for gauging whether a submarket’s improvement is broad or isolated to a few zip codes.
Pro Tip: Always match the vintage and unit mix of your comp set to your subject property. A same-unit index for Class B two-bedrooms in your submarket is far more predictive than a metro-wide asking-rent average that blends luxury new construction with workforce housing.
How to convert source data into model inputs
| Source | Metric to pull | Maps to model input |
|---|---|---|
| Apartment List (repeat-transaction) | Month-over-month and YoY same-unit rent change | Year 1 and Year 2 base growth rate |
| Yardi Matrix / CoStar | Submarket effective rent trend, vacancy rate | Base-case and downside scenario inputs |
| Local MLS / broker surveys | Closed lease comps, concession rates | Market rent step-up at lease roll |
| Municipal data | Job growth, permit activity | Demand-side justification for growth above base |
When national data and submarket data diverge, use submarket data. National averages are useful for stress-testing your downside, not for setting your base case.
How do you build year-by-year rent increase assumptions for underwriting?
The deliverable is a rent growth vector: a year-by-year percentage increase for each loan year, tied to your rent roll, documented with sources. Here is a reproducible build sequence.
Minimum inputs you need before starting:
- Current in-place rents by unit type
- Same-unit comps from the past 90 days (at least 5–10 comparable leases)
- Submarket vacancy rate and 12-month trend
- Planned renovation scope and timeline (if applicable)
- Loan term and any lender-specific growth caps
Step-by-step build sequence
-
Collect same-unit comps and vacancy trend. Pull closed lease data for comparable units in the submarket. Calculate the median effective rent (net of concessions) and compare it to your in-place rents. The gap between in-place and market rent is your “mark-to-market” opportunity, which is separate from ongoing annual growth.
-
Set lease-roll and turnover assumptions. Identify which leases expire in each year of the hold. Assign a turnover probability (typically 40–60% for stabilized multifamily) and a make-ready period (30–60 days). These assumptions reduce effective rent in the year of turnover.
-
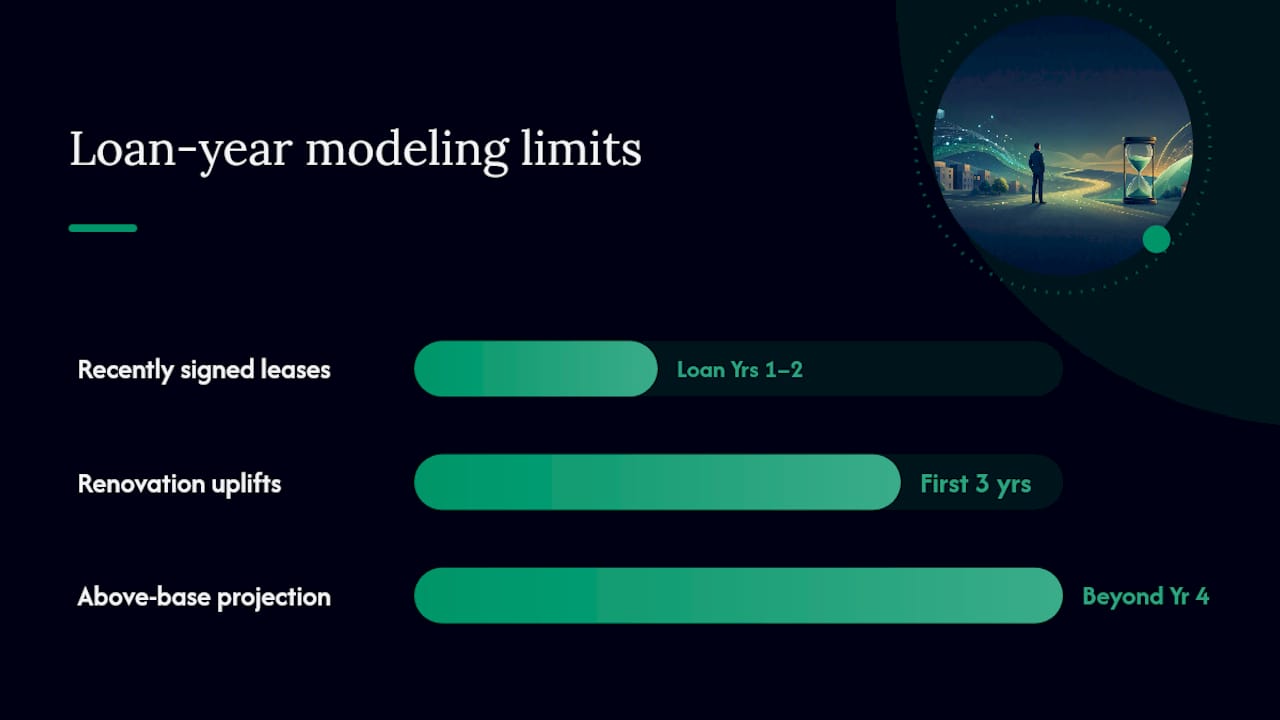
Adjust for planned renovations or lease-up timing. If you are underwriting a value-add deal, renovation-driven rent uplifts should be modeled only for the units being renovated and only within the first 3 loan years. Fannie Mae’s guidelines explicitly limit the use of recently signed lease rents to Loan Years 1–2 and discourage projecting above base-assumption income growth beyond Loan Year 4. Apply the same discipline even on private deals.
-
Map to rent roll and effective rent. Build a unit-by-unit (or unit-type-by-unit-type) rent roll that applies your growth vector to in-place rents, marks to market at turnover, and nets out concessions and vacancy. The output is effective gross income (EGI) for each year.
-
Document rationale and sources. For each growth rate you assign, record the source, the date of the data, the sample size of your comp set, and a one-sentence sponsor commentary explaining why the rate is appropriate. Lenders and auditors will ask for this.
Documentation checklist:
- Source name and URL (e.g., Apartment List, CoStar submarket report)
- Data pull date
- Number of comparable transactions in the sample
- Submarket vacancy rate at time of underwriting
- Sponsor commentary on any deviation from market indices
- Version control note (date of last update)
For renovation-driven deals, the BRRRR calculator at Real Estate Investor Toolkit lets you model the rehab timeline, lease-up period, and post-renovation rent separately from your stabilized growth assumptions, keeping the two distinct in your model.
How should you stress-test rent increase assumptions?
Run at least three named scenarios and a percentage sensitivity sweep before presenting any model to a lender or equity partner.
Scenario templates
Baseline: Uses your documented same-unit comp growth rate and current submarket vacancy. This is your most-likely case, not your optimistic case.
Downside: Reduce annual rent growth by 150–200 basis points from baseline. Apply a 100–150 basis point increase in vacancy. Extend lease-up periods by 30–60 days.
This scenario tests whether the asset can survive a demand shock or a significant supply delivery in the submarket.
Beyond these three, add scenario-specific triggers:
- Supply shock: Model the impact of a large new delivery (200+ units) within a 1-mile radius. Typically adds 150–300 basis points to effective vacancy for 12–18 months.
- Policy shock: If the submarket has active rent stabilization legislation, cap your annual growth at the applicable limit. Several major U.S. metros have rent control ordinances that restrict annual increases to CPI or a fixed percentage, and your model must reflect the legal ceiling, not the market ceiling.
- Macroeconomic shock: Rising interest rates compress cap rates and increase refinancing risk. Model a 50–100 basis point cap rate expansion at exit alongside your flat-rent scenario to see the combined impact on terminal value and IRR.
Pro Tip: Look for tipping points, not just averages. That tipping point tells you exactly how much cushion your deal has.
Sensitivity structure
Build a table with rent growth variations in the rows and key metrics in the columns. A typical structure:
Tornado charts are useful when you have multiple variables in play. Rank variables by their impact on IRR (rent growth, exit cap rate, vacancy, interest rate) and the chart immediately shows which assumption your deal is most sensitive to. If rent growth is the dominant bar, your underwriting needs more comp support, not more optimism.
What lender rules and industry norms govern rent projections?
Lender constraints are not suggestions. They define the outer boundary of what your model can claim, and violating them triggers an alternative-risk analysis requirement that slows or kills a deal.
Fannie Mae’s Part II Section 204.02 states that rents from recently signed leases may only be used to estimate income growth in Loan Years 1–2. Projecting rents above the Base Assumption Income Growth Rate beyond Loan Year 4 is generally discouraged, and any deviation requires reliable market evidence submitted to and accepted by the lender.
The practical implications for your model:
- Loan Years 1–2: You can use recently signed lease rents as evidence of achievable market rent. This is where renovation-driven uplifts and mark-to-market gains belong.
- Loan Years 3–4: Growth must align with a recognized market index (Yardi, CoStar, Apartment List) and be consistent with submarket vacancy trends.
- Loan Year 5 and beyond: Projections above the Base Assumption Income Growth Rate require documented market evidence, sponsor track record, and often a third-party market study.
Typical lender tests your model will face:
- Consistency with at least one named national or submarket rent index
- Comp set sample size of at least 5–10 comparable closed leases
- Sponsor track record demonstrating achieved rents on comparable renovations
- Vacancy assumption consistent with submarket data, not a best-case scenario
- Concession and turnover assumptions that reflect actual market conditions
Private lenders and bridge lenders often apply similar heuristics even without a formal DUS framework, because the same tail risks apply. Treating Fannie Mae’s limits as a floor for discipline, not just a compliance checkbox, protects you on private deals too.
What are the most common mistakes in rent increase underwriting?
Aggressive growth without market support and failure to model turnover and concessions are the two errors that appear most often in deals that fail lender review or underperform projections.
Common underwriting mistakes:
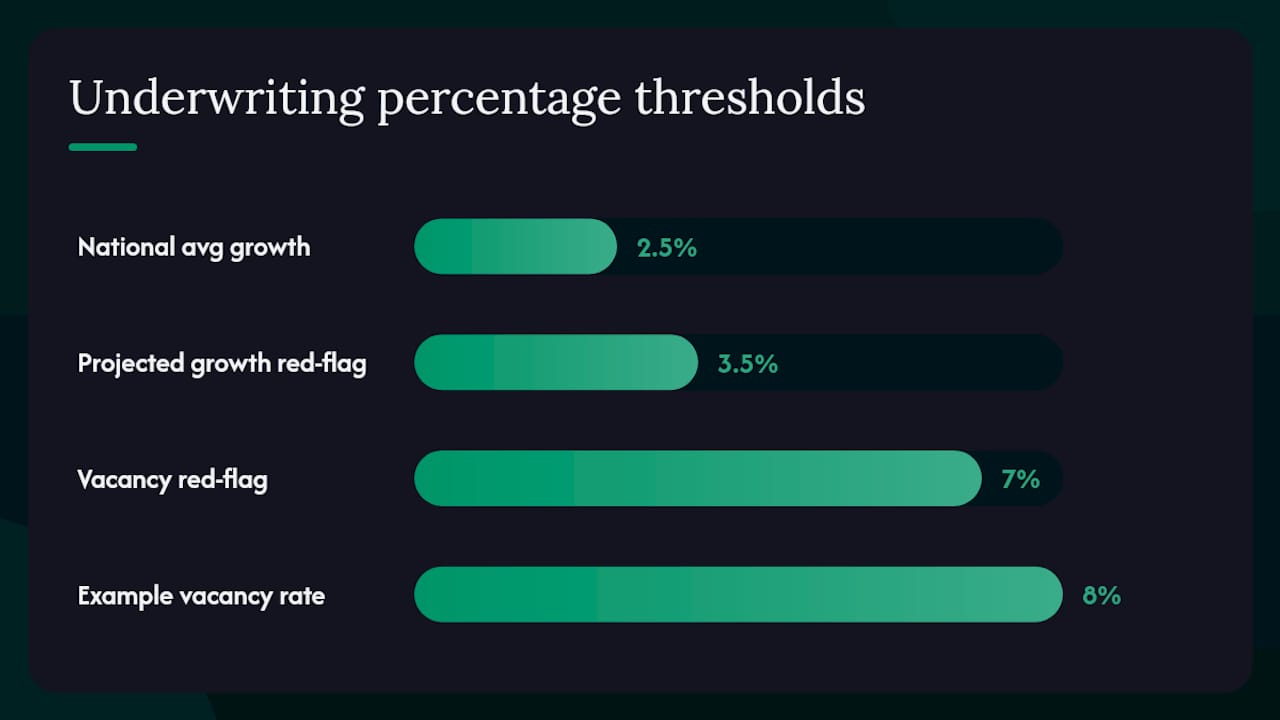
- Over-relying on national indices. A 2.5% national average tells you almost nothing about a specific submarket. Submarket vacancy is the primary filter for whether that national figure is even directionally relevant to your deal.
- Extending renovation-driven uplifts beyond Loan Year 3. Renovation premiums are a one-time mark-to-market event, not a permanent growth accelerant. Modeling them as ongoing annual growth double-counts the benefit.
- Using asking rents instead of closed lease comps. Asking rents overstate achievable rents in soft markets. Always use closed transaction data, net of concessions.
- Ignoring vacancy trends. A vacancy rate of 8% that is falling is a very different signal from a vacancy rate of 8% that is rising. Direction matters as much as level.
- Assuming immediate capture of market rents after renovation. Lease-up takes time. A 30–60 day vacancy period per unit during renovation is standard; ignoring it inflates Year 1 and Year 2 EGI.
- Mismatching unit mix. Applying a two-bedroom rent growth rate to a portfolio with 60% one-bedrooms produces a systematically biased projection.
- Ignoring rent control laws. Several major U.S. cities cap annual increases at CPI or a fixed percentage. Modeling above the legal ceiling is not aggressive underwriting; it is a factual error.
Quick red-flags checklist (under 10 minutes):
- [ ] Is the projected rent growth rate above 3.5% annually in a submarket with vacancy above 7%?
- [ ] Are renovation-driven uplifts modeled beyond Loan Year 3?
- [ ] Are recently signed lease rents used as growth evidence beyond Loan Year 2?
- [ ] Is the comp set fewer than 5 closed transactions?
- [ ] Does the model use asking rents rather than effective (net of concessions) rents?
- [ ] Is the submarket subject to rent stabilization or rent control, and is the cap reflected?
- [ ] Are turnover costs and make-ready vacancy periods included in the rent roll?
Any “yes” on this list warrants a revision before the model goes to a lender or equity partner.
How do you operationalize rent assumptions with calculators and templates?
The workflow is: collect, normalize, model, stress-test, document. Each step maps to a specific tool or template action.
Step-by-step workflow
-
Collect: Pull same-unit comps from Apartment List, CoStar, or your local MLS. Download the submarket vacancy trend from Yardi Matrix or a broker survey. Record the data pull date and sample size.
-
Normalize: Convert all rents to effective rent (face rent minus concessions, divided by lease term). Adjust for unit mix differences (square footage, bedroom count, amenities). This is your normalized comp set.
-
Model: Enter your normalized comp data into the rental property calculator at Real Estate Investor Toolkit. Input your year-by-year rent growth vector, vacancy rate, turnover assumption, and operating expense ratio. The calculator outputs NOI, cash flow, cap rate, and cash-on-cash return for each year of your hold.
-
Stress-test: Run your three scenarios (baseline, downside, severe downside) by adjusting the rent growth and vacancy inputs. Export the outputs and build your sensitivity table.
-
Document: Record every input, its source, the date, and a brief rationale. Attach the documentation to your deal file. This is what lenders and auditors review.
Sample input fields for your rent assumption template
For value-add deals where renovation timing drives the rent story, the BRRRR method guide at Real Estate Investor Toolkit walks through how to sequence rehab costs, lease-up, and stabilized rent assumptions so they stay audit-friendly. A rental income projection guide can also help you structure the inputs before you bring them into a calculator.
For a deeper look at how rent growth interacts with cap rate and cash-on-cash return, the cap rate vs. cash-on-cash guide at Real Estate Investor Toolkit explains which metric shifts most with rent growth assumptions and when each one should drive your decision.
The underwriting heuristic that holds up under scrutiny
My working rule: anchor your base-case rent growth to submarket vacancy direction, cap renovation uplifts to the first 3 loan years, and never project above your lender’s Base Assumption Income Growth Rate beyond Loan Year 4 without a third-party market study in hand.
The reason this heuristic works is behavioral as much as analytical. Lenders have seen enough deals where sponsor optimism outran market reality that they built explicit guardrails into their guidelines. Matching your model to those guardrails is not conservative; it is credible. A model that survives lender scrutiny is also more likely to survive the market. Run your three scenarios every time, document every input, and treat the tipping-point analysis as the most important output, not the base-case IRR.
Real Estate Investor Toolkit puts your rent assumptions to work instantly
Modeling rent growth correctly takes the right inputs and a calculator that handles the math without forcing you to rebuild a spreadsheet from scratch. Real Estate Investor Toolkit’s rental property calculator accepts your year-by-year rent growth vector, vacancy rate, turnover assumption, and operating expenses, then outputs NOI, DSCR, cash flow, and cap rate across your full hold period. No sign-up required to run your first scenario.
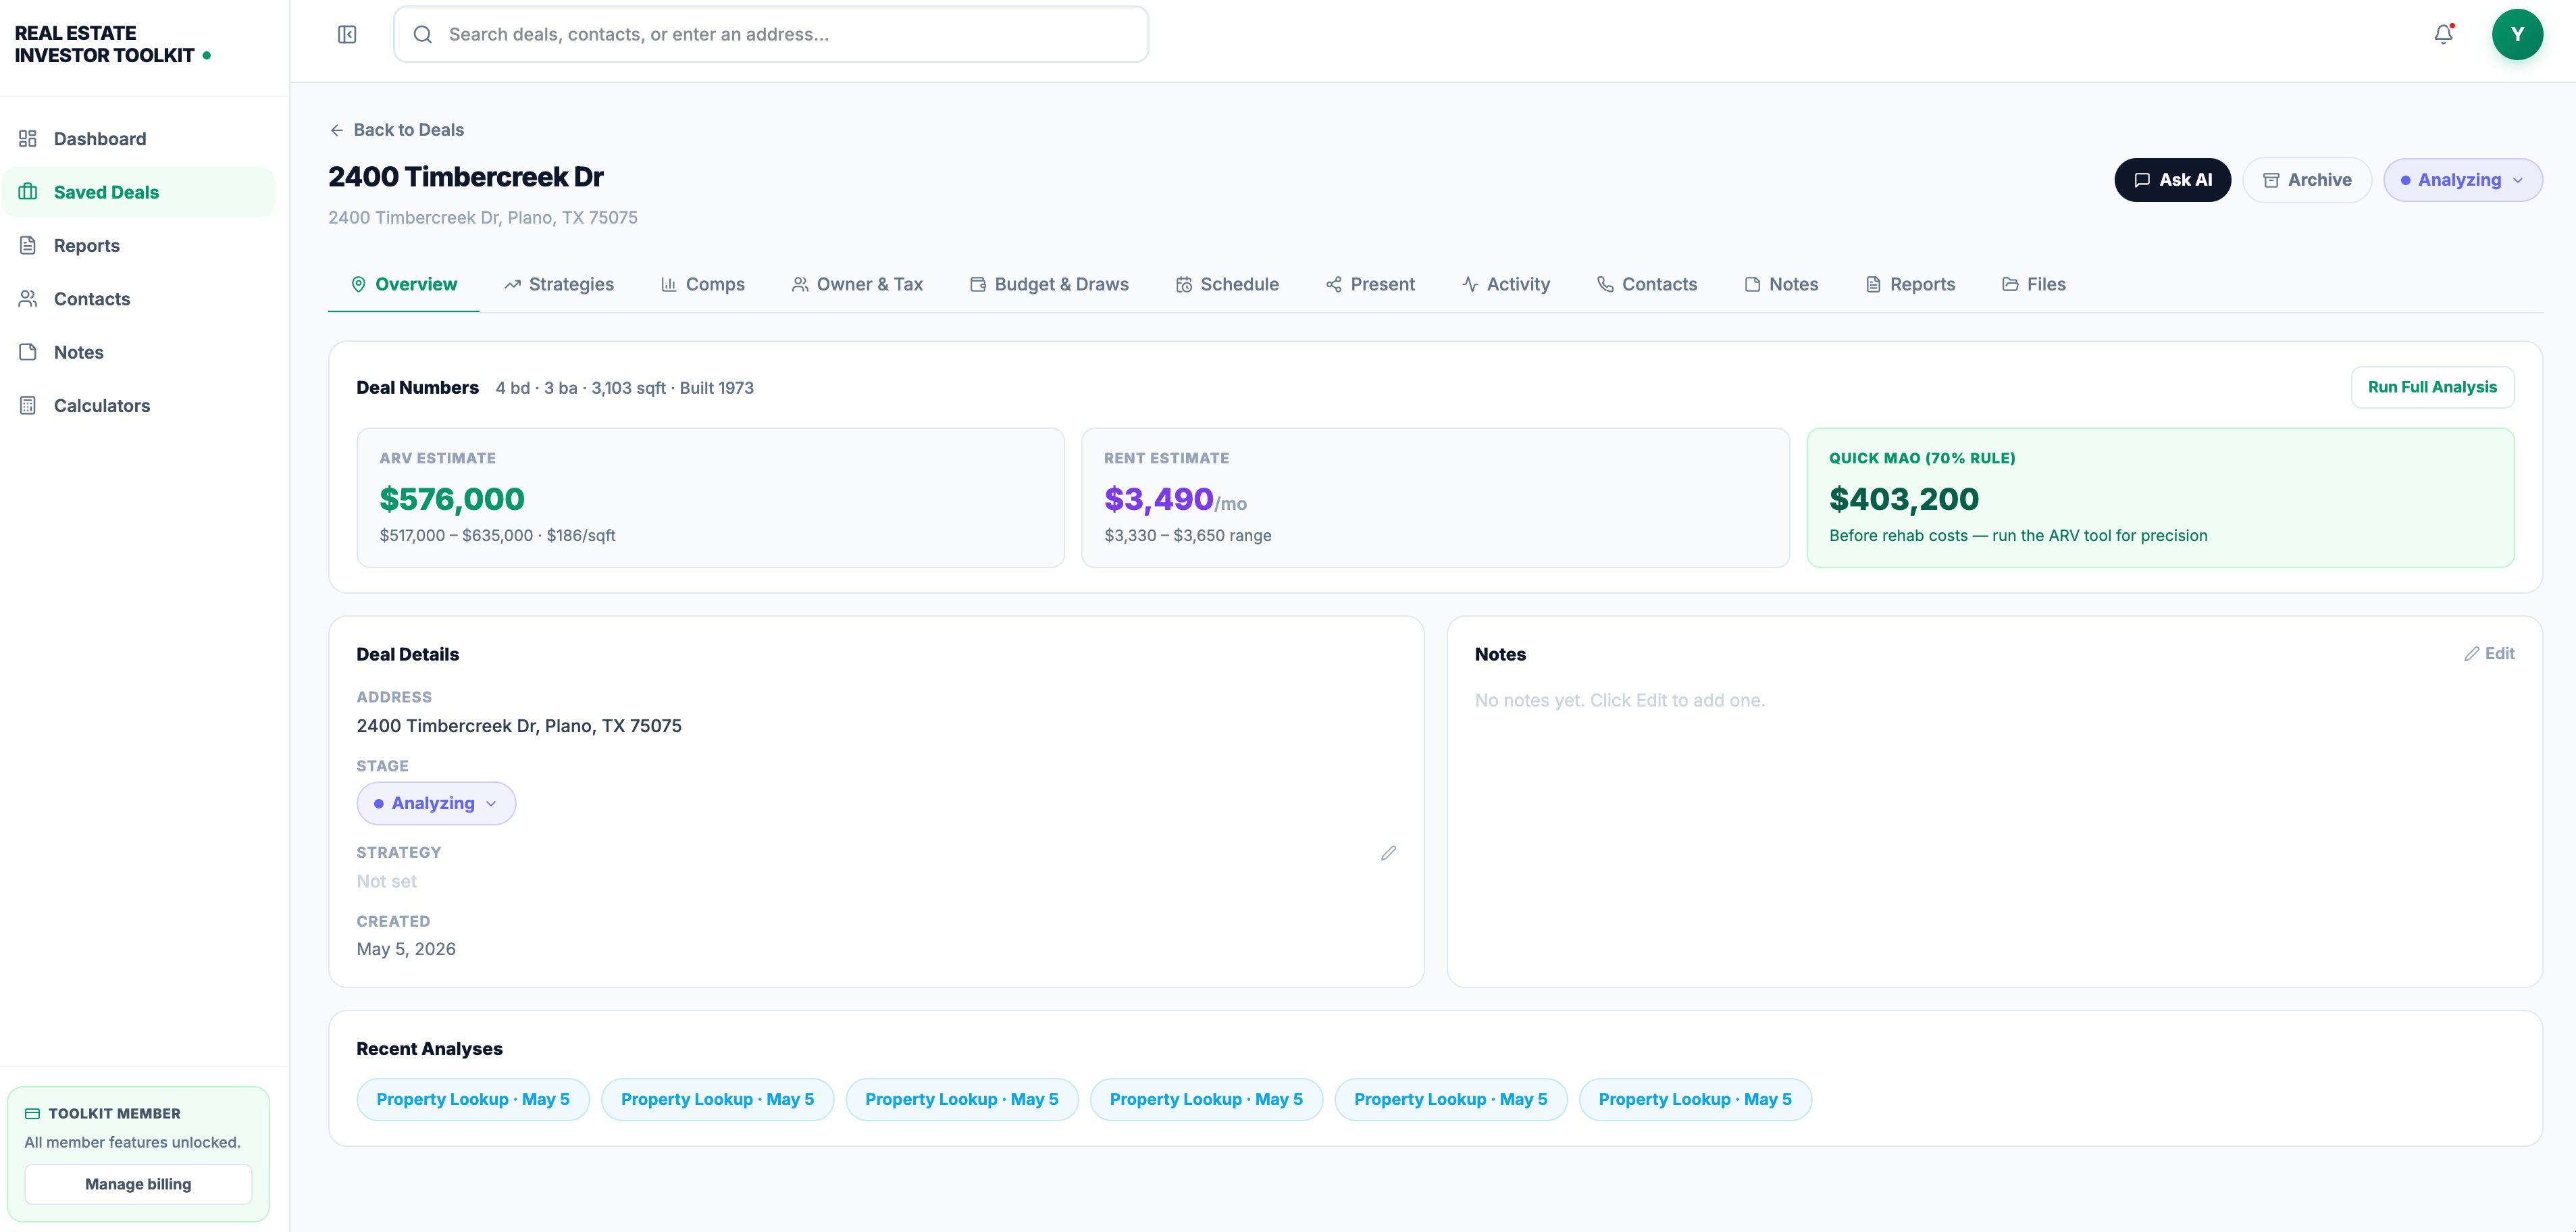
For renovation-driven deals, the BRRRR calculator keeps your rehab timeline and post-renovation rent uplift separate from your stabilized growth assumptions, exactly the structure lenders expect. The comps analyzer pulls comparable sales and rental data to support your same-unit comp set. Run your baseline, downside, and severe downside scenarios in minutes, export the outputs, and attach them to your deal documentation. Start with the rental calculator and build your first stress-tested rent model today.
Sources
The sources below back the modeling guidance in this article and are the first places to check when you need current market data or lender rules.
- Part II Section 204.02 Alternative Assumptions (Fannie Mae guidance)
- How Rent Prices Are Determined: The Economics of Rental Pricing | US Rent Prices | USRentPrices
- Decoding Rent Determinants in Urban Housing Markets: A Multi-Perspective Multimodal Machine Learning Analysis
- Apartment List National Rent Data
- Yardi Matrix projects modest national multifamily rent growth for 2026
This article is general information, not a substitute for advice from a qualified financial advisor. Consult a qualified financial professional about your own circumstances before acting on anything here.
Recommended
- Investment Property Financing Calculator | Real Estate Investor Toolkit
- How to Analyze a Rental Property: Cash Flow, Cap Rate, and the 1% Rule — Real Estate Investing Guide | Real Estate Investor Toolkit
- How to Underwrite BRRRR Refinance Risk Before It Wrecks the Deal — Real Estate Investing Guide | Real Estate Investor Toolkit