Under an Hour: Evidence First Remote Deal Analysis for Investors

Remote deal analysis is the process of turning listing documents, financials, and comps into decision-ready numbers and a deal-fit score without ever walking the property. The outcome you should expect: normalized cash flow figures, an After Repair Value (ARV) estimate, and a red-flag summary that tells you whether to pursue, pass, or push for a price cut, all built from a T-12 and a handful of other source documents.
TL;DR:
- Most critical metrics for remote analysis are NOI, cap rate, cash-on-cash return, DSCR, and IRR, which depend on accurate, recent data for validity.
- Verifying data accuracy involves cross-referencing income, expenses, and comps with independent sources like tax records, lease abstracts, and recent sales, to prevent inflating figures.
- Using tools that normalize unstructured data and link figures to source documents enhances traceability and reduces errors, especially when dealing with PDFs or inconsistent formats.
- Red flags such as owner dependency, unsupported addbacks, lease escalation gaps, and deferred maintenance can significantly distort deal valuations and require careful scrutiny.
- Remote analysis suffices for initial screening of stabilized rentals and simple fix-and-flip deals, but in-person verification is essential when heavy addbacks or complex tenant situations exist.
Table of Contents
- What Does Remote Deal Analysis Actually Cover?
- Which Financial Metrics Actually Prove a Deal Works?
- What Documents Do You Need, and How Do Tools Read Them?
- How Should You Read an Automated Deal Score?
- How Do You Run a Remote Analysis in Under an Hour?
- How Real Estate Investor Toolkit Supports This Workflow
- How Does Remote Analysis Fit Into Your Broader Portfolio?
- What Goes Wrong With Remote Analysis, and How Do You Fix It?
- How Do You Verify Data Accuracy Without Visiting the Property?
- How Do You Protect Deal Data When Analyzing It Remotely?
- What Does Remote Deal Analysis Look Like in Practice?
- When Is Remote Analysis Enough, and When Do You Need Boots on the Ground?
- Try Real Estate Investor Toolkit’s Free Calculators Today
- When Remote Analysis Is Sufficient, and When It Isn’t
- Sources
- FAQ
What Does Remote Deal Analysis Actually Cover?
Real remote deal analysis follows a five-stage pipeline: find, research, analyze, compare, present. Each stage produces a specific output, and skipping one usually shows up later as a bad surprise at closing.
You find a property through a listing, a wholesaler’s email, or an off-market lead. Research means pulling the T-12, rent roll, tax records, and comps before you build a single spreadsheet cell. Analysis converts those documents into a pro forma, a Maximum Allowable Offer (MAO), and a preliminary deal-fit score. Comparison stacks that deal against others in your pipeline, or against your own hold criteria. Presentation packages the findings into something you can act on or hand to a partner or lender.
The standard outputs from a full remote pass include:
- A normalized T-12 with owner addbacks flagged separately from operating expenses
- A pro forma projecting income and expenses under current management
- An MAO calculation tied to your target ARV and rehab budget
- A weighted deal-fit score reflecting cash flow, market, execution, and risk factors
- A one-page red-flag memo listing anything that needs a follow-up question
Which outputs matter most depends on strategy. Buy-and-hold investors lean hardest on DSCR and cap rate. Fix-and-flip buyers care almost entirely about ARV accuracy and rehab cost discipline. BRRRR investors need all of it at once, since the refinance step depends on both the rehab math and the post-repair rental income holding up under a lender’s underwriting.
Which Financial Metrics Actually Prove a Deal Works?
Five numbers do most of the work in any remote underwrite, and each one maps to a specific document you should have in hand before you trust the output.
- Net Operating Income (NOI) — annual rental income minus operating expenses, excluding debt service. Pulled from the T-12 and rent roll.
- Cap rate — NOI divided by purchase price. This tells you the unlevered return and lets you compare deals across markets.
- Cash-on-cash return — annual pre-tax cash flow divided by total cash invested. This is the number that matters most once financing enters the picture.
- Debt Service Coverage Ratio (DSCR) — NOI divided by annual debt payments. Lenders typically want this at 1.20 or higher before they’ll fund a deal.
- Internal Rate of Return (IRR) — the annualized return across a full hold period, factoring in the eventual sale or refinance.
Every one of these breaks down fast if the underlying inputs are wrong, which is why sanity checks matter more than the formulas themselves. If the T-12 shows a NOI margin above 65% on a Class C multifamily property, question it. That is usually a sign of stripped-out capital expenditures or an aggressive addback. If a rent roll shows in-place rents 20% above the rest of the comps, verify lease dates before you trust the number.
For rehab deals, MAO and ARV do the heavy lifting instead of cap rate. Pro Tip: Run your ARV through an independent comps pull before you accept a broker’s number. A comps analyzer that pulls recent, nearby, similar-condition sales will catch an inflated ARV faster than eyeballing a spreadsheet. Experts increasingly recommend treating every metric output as a range rather than a single figure, since confidence-weighted forecasts communicate uncertainty and negotiation leverage far better than a false-precision point estimate.
What Documents Do You Need, and How Do Tools Read Them?
A complete remote package needs the trailing twelve months of income and expense history (T-12), a current rent roll, lease abstracts for major tenants, the offering memorandum or CIM, a recent profit-and-loss statement, property photos, and comparable sales. Missing even one of these forces guesswork into the analysis.
The harder problem is format. Sellers hand over scanned PDFs, screenshots of spreadsheets, broker emails with numbers buried in paragraphs, and sometimes voice memos describing unit mix. Platforms built for this extract line items from CIMs, PDFs, and Excel files and normalize them into comparable metrics in minutes rather than hours, according to DealScreen’s product documentation. That normalization step is what separates a real evidence layer from a basic calculator; handling genuinely unstructured data formats is what distinguishes professional-grade tools from a spreadsheet template.
Traceability matters as much as extraction. A number with no source is a number you can’t defend to a lender or a partner. Purpose-built diligence tools now combine extraction with retrieval methods that link every reported figure back to the specific document and line where it originated, which cuts down on the kind of hallucinated outputs that plague generic AI summarization.
- T-12 and rent roll establish current income and expense reality
- Lease abstracts reveal escalation clauses and renewal risk
- OM/CIM provides the seller’s narrative, which needs independent verification
- Comps validate ARV and rental rate assumptions against the actual market
How Should You Read an Automated Deal Score?
A single fit score without context is close to useless. What matters is the architecture behind it, and whether the platform shows you why it landed where it did.
Modern scoring systems typically weight deals across four pillars: cash flow, market conditions, execution difficulty, and risk. A property can score high on cash flow and still get flagged red on risk if the lease structure is fragile or the seller’s numbers depend heavily on one tenant. Platforms built for this grade deals across six to ten or more weighted pillars and surface commercial risks automatically rather than burying them in a footnote.
Watch for these red flags specifically:
- Owner dependency — the business or property performance relies on the current owner’s personal relationships or unlicensed labor
- Addbacks without support — NOI inflated by owner add-backs that aren’t tied to specific line items or receipts
- Lease escalation gaps — below-market rents with no contractual path to catch up
- Deferred maintenance — capital expenditures pushed off that will hit your budget within 12 to 24 months
Addback treatment deserves particular scrutiny. Addbacks presented without the original line item and supporting evidence sitting right next to them can materially inflate NOI and throw off your MAO by tens of thousands of dollars. Insist on drilldowns, not just a headline score, and treat any forecast as a range rather than a promise.
How Do You Run a Remote Analysis in Under an Hour?
- Intake. Collect or paste the T-12, rent roll, asking price, and property address. Minimum viable intake takes ten minutes if the documents are already digitized.
- Normalize and sanity check. Run the numbers through your tools and flag anything that looks inflated, especially NOI margins and in-place rents versus comps.
- Model three scenarios. Build aggressive, base, and conservative cases and identify which single assumption (vacancy, rent growth, exit cap rate) moves your IRR the most.
- Review red flags and set questions. Turn every flag into a specific question for the seller or broker before you draft a letter of intent.
- Produce a one-page brief. Summarize the deal-fit score, key metrics, red flags, and source links so a partner or lender can review it in five minutes.
Pro Tip: Keep your scenario bands consistent across every deal in your pipeline. A defensible workflow uses the same three bands and the same sensitivity table every time, so you’re comparing deals on equal footing instead of shifting your assumptions deal by deal.
How Real Estate Investor Toolkit Supports This Workflow
Every stage above maps to a specific calculator. Intake and rehab budgeting run through the rehab cost calculator, ARV validation runs through the ARV calculator, and MAO math ties the two together automatically. Rental cash flow, DSCR, and cap rate calculations live in the rental property calculator, while BRRRR deals get their own dedicated model in the BRRRR calculator that walks the refinance math step by step.
Comps validation, one of the most commonly skipped steps in a rushed remote analysis, runs through a dedicated comps analyzer rather than a broker’s word alone. Each tool produces an exportable output you can drop straight into the one-page brief described above.
How Does Remote Analysis Fit Into Your Broader Portfolio?
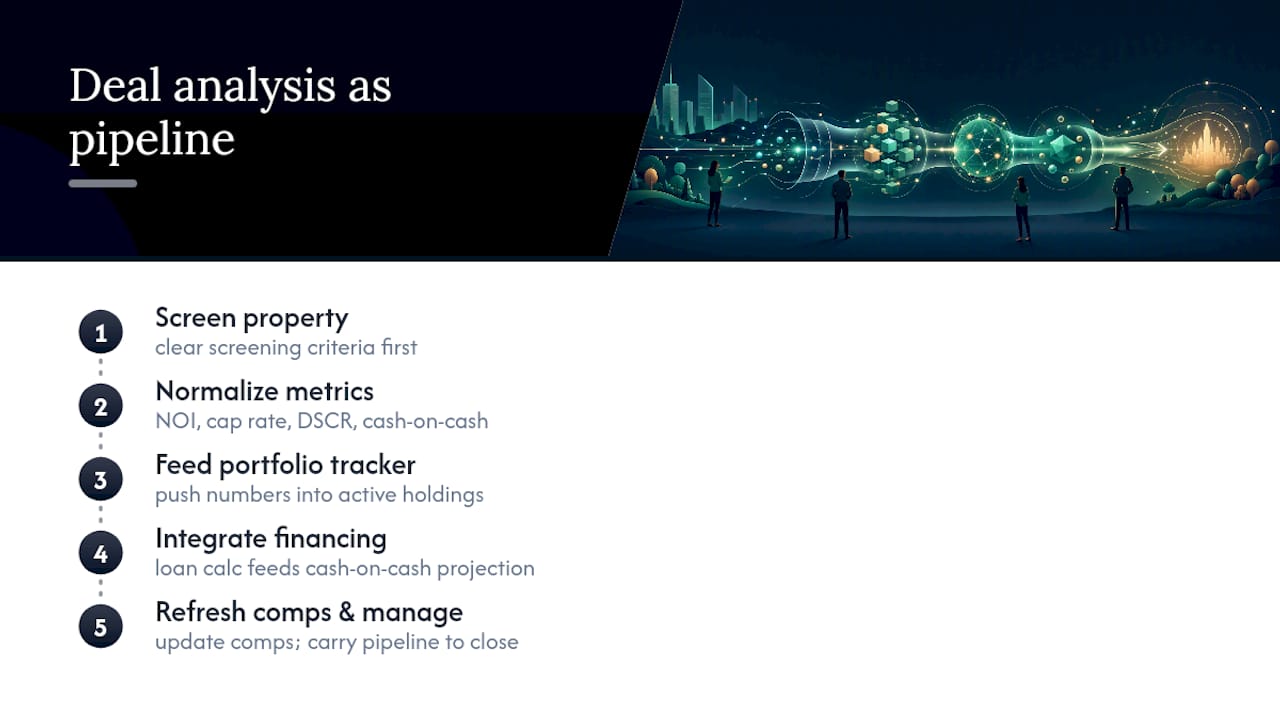
A single deal score is only useful if it talks to the rest of your investment tracking. Otherwise you end up with a strong analysis sitting in an isolated PDF while your actual portfolio spreadsheet lags behind by weeks.
The practical fix is treating deal analysis as one stage of a pipeline rather than a standalone task. Once a property clears your screening criteria, the same normalized numbers, NOI, cap rate, DSCR, projected cash-on-cash, should flow into whatever system tracks your active holdings, so you’re comparing a prospective deal against your existing portfolio’s actual performance rather than against assumptions. Investors managing more than a handful of properties typically want that continuity: a saved deal pipeline that carries forward from initial screening through close and into ongoing management, rather than re-entering the same numbers into three different tools.
Financing scenarios deserve the same treatment. If you’re modeling a hard-money bridge loan on a flip, a hard money loan calculator that shows the true cost of points and short-term interest should feed directly into your cash-on-cash projection, not sit in a separate tab you forget to reconcile. The same logic applies to comps data: pulling comps once during analysis and never refreshing them means your exit assumptions go stale the longer a deal sits in your pipeline. Integration, in practice, means fewer places where a number can drift from the truth.
What Goes Wrong With Remote Analysis, and How Do You Fix It?
The most common failure isn’t a bad formula. It’s trusting a document you never should have trusted in the first place.
Sellers and brokers sometimes hand over a T-12 that’s been quietly cleaned up, expenses trimmed, one bad month excluded, addbacks stacked without support. If your analysis takes that document at face value, every downstream number inherits the distortion. The fix is procedural: cross-reference the T-12 against tax records and, where possible, a recent bank statement or utility bill, before you build a pro forma around it.
A second pitfall is over-trusting a single-point output. A model that spits out “12.4% IRR” with no range attached invites false confidence. Push for confidence-weighted ranges instead, and treat a tight range as a green light and a wide one as a signal to dig further before committing earnest money.
Stale comps cause a third common error, particularly in fast-moving markets where a comp pulled 60 days ago no longer reflects current pricing. Refresh your comps at the point of offer, not just at initial screening.
Finally, remote analysis can miss physical realities that no document captures, foundation issues, odor problems, a rougher block than the photos suggest. Mitigate this by treating remote analysis as the screening filter that narrows fifty prospects down to three, not as a full substitute forever setting foot on a serious contender.
How Do You Verify Data Accuracy Without Visiting the Property?
Verification comes down to cross-referencing every important number against at least one independent source before it enters your model.
Start with the T-12 against public tax records, which typically list assessed value and, in many counties, prior sale price. A gap between the seller’s claimed income and the tax assessor’s records is worth a direct question. Rent rolls should be checked against lease abstracts line by line. If a unit shows $1,400 in the rent roll but the lease on file shows $1,200 with a step-up clause that hasn’t triggered yet, that’s not a rounding error, it’s a live discrepancy that changes your NOI.
Comps deserve the same discipline. Pull comps independently rather than relying solely on a broker’s package, and weight recent, nearby, similar-condition sales over anything more than 90 days old or more than a mile away in an active market. Photos help here too. Compare listing photos against satellite imagery and street view for consistency, since mismatched exteriors or suspiciously dated photos are an easy early flag.
Traceability is the underlying principle that ties all of this together. Every reported figure should link back to the specific document and line item it came from, not just appear as a number on a dashboard. That evidence layer is what lets you, or a lender reviewing your file, verify a claim in seconds instead of re-requesting documents days before closing.
How Do You Protect Deal Data When Analyzing It Remotely?
Deal documents carry sensitive information, seller financials, tenant details, sometimes personal identifying information buried in leases, and remote analysis means that data moves through more systems than a face-to-face closing ever would.
Treat any platform handling your documents the way you’d treat a bank: check whether it encrypts data in transit and at rest, and whether uploaded documents are used to train models you don’t control or shared with third parties beyond what’s necessary to run the analysis. Free calculators that don’t require account creation carry less exposure by design, since there’s no persistent profile tied to your uploads. Paid platforms with saved pipelines should be explicit about data retention and deletion policies, particularly for sensitive seller financials you may only need for a few weeks.
Practical habits matter as much as platform choice. Strip personally identifying tenant information from documents before uploading them to any tool where it isn’t strictly necessary. Use unique, strong credentials for any platform storing your deal pipeline, and be cautious about sharing login access across a team without individual accounts, since shared logins make it impossible to audit who touched what. If you’re emailing sensitive OMs or CIMs to partners for review, a password-protected file beats a plain attachment every time.
What Does Remote Deal Analysis Look Like in Practice?
Consider a fourplex listed through a wholesaler’s email with a T-12 attached as a scanned PDF and a rent roll typed into the email body itself, a common and messy real-world scenario.
A remote workflow starts by extracting the scanned T-12 into structured line items, then cross-referencing the email’s rent figures against those line items. Suppose the T-12 shows a NOI of $38,000 on a $410,000 asking price, a 9.3% cap rate that looks unusually strong for the neighborhood. Pulling comps immediately shows two similar fourplexes sold in the past 90 days at cap rates closer to 6.8%. That gap alone is worth a phone call: either the seller found an exceptional deal, or the T-12 has hidden addbacks.
Digging into the T-12 reveals $6,200 in “owner-performed maintenance” added back to NOI with no receipts attached. That’s the kind of discrepancy a red-flag memo exists to catch before it costs you money at closing.
A second scenario: a small multifamily deal analyzed through a platform accepting a pasted CIM produces a scenario model in minutes rather than the hours a manual build would take, letting the investor move on a competitive off-market lead the same day it arrived. Speed matters most precisely when several buyers are looking at the same listing.
When Is Remote Analysis Enough, and When Do You Need Boots on the Ground?
Remote analysis works well for initial screening and most stabilized rentals. Require a site visit once you’re near LOI, when addbacks are heavy, tenant mix is complex, or a lender demands in-person verification before funding.
Try Real Estate Investor Toolkit’s Free Calculators Today
You’ve seen what a full remote workflow requires: normalized financials, validated comps, an honest MAO, and a red-flag memo you can actually defend. Real Estate Investor Toolkit gives you the calculators to run every one of those steps without creating an account first, which means you can screen a deal the moment it lands in your inbox instead of waiting on a signup flow.
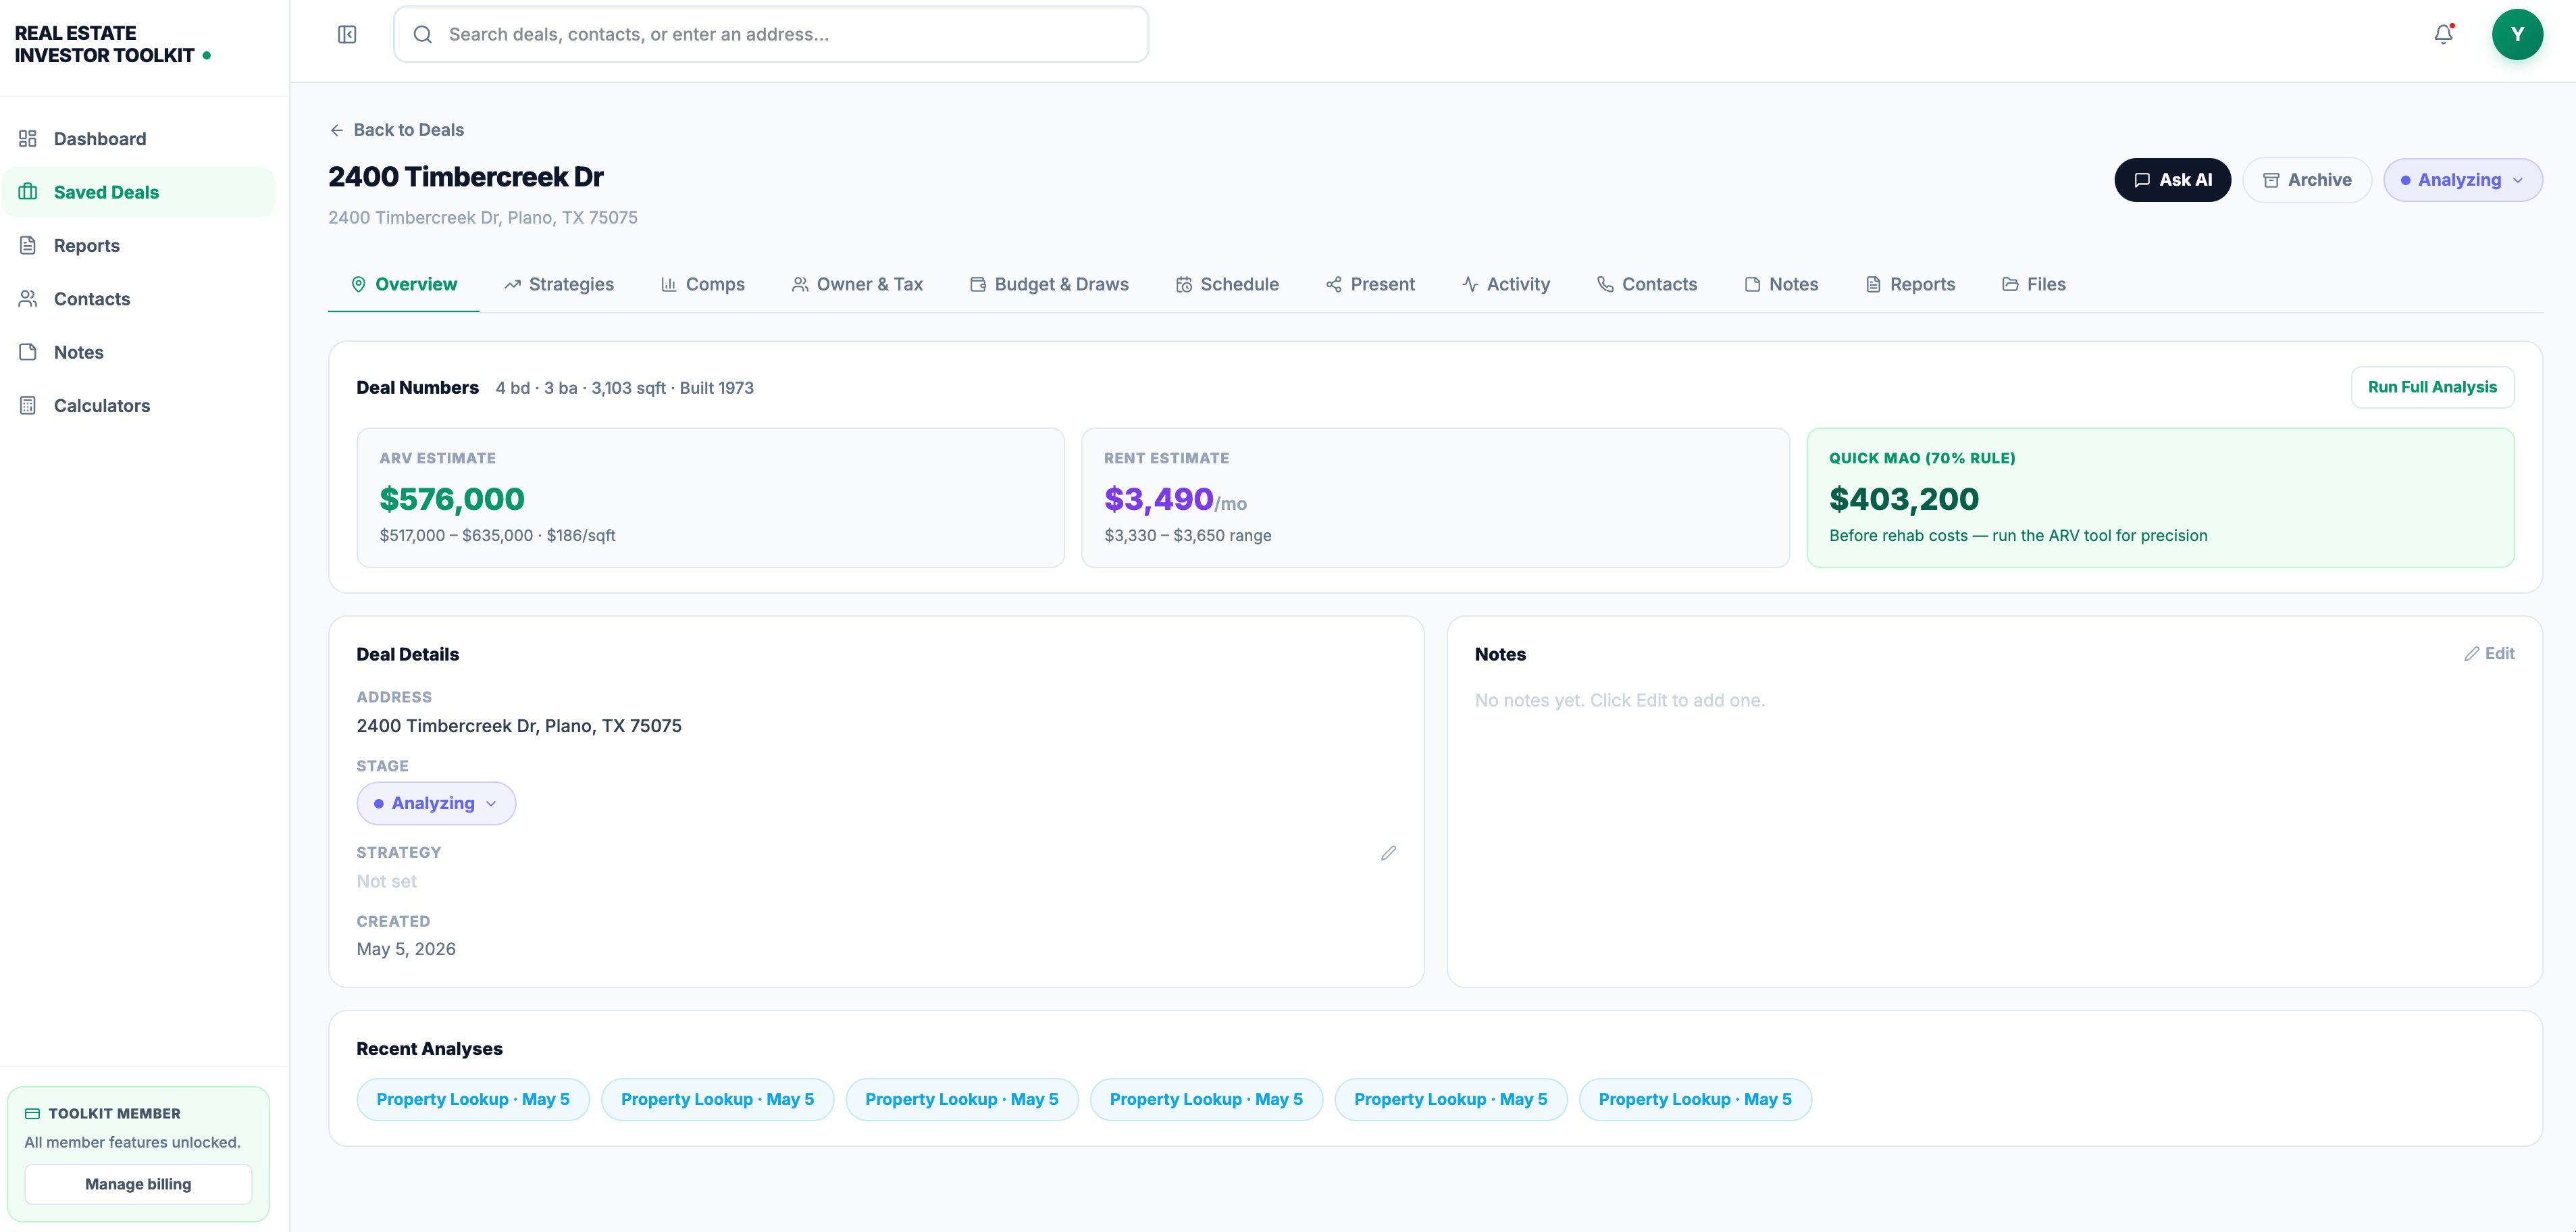
Start with the free calculators for ARV, rehab costs, and rental cash flow, no sign-up required, verified market data built in. Once you’re managing more than a couple of deals at a time, RHET DealFlow adds saved pipelines, unlimited reports, and an AI assistant that helps interpret the numbers you’ve already pulled. Full plan details and current pricing are available on the pricing page. Run your next lead through the calculators before you make an offer, not after.
When Remote Analysis Is Sufficient, and When It Isn’t
Remote underwriting handles stabilized rentals, straightforward fix-and-flips, and early-stage screening well. Once addbacks run heavy, tenant mix gets complicated, or a lender requires in-person verification, that’s your signal to walk the property before you commit capital. Speed is only valuable when the numbers underneath it hold up.
— Michael
Sources
For deeper technical background, see DealScreen’s approach to financial extraction, MongoDB’s explainer on unstructured data, and Real Estate Investor Toolkit’s deal analysis guide.
- DLAnalyzer announces $1M raise to scale AI real estate platform
- Dealscreen
- What is unstructured data? | MongoDB
- AAAI paper on calibrated uncertainty in model outputs
FAQ
How Can You Make $2,000 a Week Working From Home in Real Estate?
Consistent income at that level typically comes from wholesaling multiple deals a month or managing a growing rental portfolio, not from a single remote analysis skill. Remote deal analysis tools speed up the screening process so you can evaluate more prospects per week, which is the real lever behind higher volume.
What Is the 7% Rule in Real Estate?
Treat it as a rough screening filter, not a substitute for a full NOI, cap rate, and DSCR analysis.
How Much Do Deal Desk Analysts Make?
Compensation varies widely by industry, company, and experience level, and current figures are best checked on job platforms rather than quoted as a fixed number here. Listings for remote Deal Desk Analyst roles show the work centers on financial modeling and tooling, the same core skills that apply to remote real estate deal analysis.
How Do You Make $1,000 a Week Remotely in Real Estate?
Most investors reach that level through a combination of active deal sourcing, fast remote screening to avoid wasted time on weak leads, and a repeatable underwriting process rather than any single tactic. Tools that normalize documents and score deals automatically help you screen more opportunities in less time, which increases your odds of finding the deals that pay.
What Does Real Estate Investor Toolkit Cost?
Real Estate Investor Toolkit offers free calculators with no sign-up required, and a paid plan at $39.99 per month for unlimited reports, saved pipelines, and AI-assisted deal insights, detailed on the pricing page.