Owner Occupancy Rate: What It Means and How Accurate It Is

The owner occupancy rate is the share of occupied housing units where the owner, or a co-owner, lives. You calculate it by dividing owner-occupied units by all occupied units, and the Census Bureau explains the definition on its QuickFacts notes. For the U.S. as a whole the figure is about 65%. For an investor, the number is useful only when you know its geography, its data year and its margin of error.
This guide covers the formula, what counts as owner-occupied, where to find current figures, how much to trust them and what they can and cannot tell you about a deal.
TL;DR
- The rate equals owner-occupied units divided by occupied units, times 100. Vacant units are left out of the math.
- The U.S. rate is roughly 65%. The share of adults who own homes is closer to 53%, because the two measures count different things.
- Figures come from surveys, so they carry a margin of error. Check the geography and the data vintage before you compare two numbers.
- Florida and Texas differ sharply from the national rate, and counties inside each state differ even more.
- Use the rate as market context, then confirm each property’s owner status with property-level data.
Table of Contents
- What the owner occupancy rate measures
- How to calculate the owner occupancy rate
- Where to find U.S., Florida and Texas figures
- How accurate is the owner occupancy rate?
- What the rate can and cannot tell an investor
- A simple workflow for using the rate in your market research
- Perspective
- Run the numbers on your next deal
- FAQ
- Sources
What the owner occupancy rate measures
The rate counts housing units, not people. A unit is owner-occupied when the owner or a co-owner lives in it. The Census Bureau’s definition covers units with a mortgage, units under another debt arrangement and units not yet fully paid off. Its notes list deeds of trust, land contracts, purchase agreements and mortgaged units on leased land as qualifying arrangements.
Everything else that is occupied is renter-occupied. Vacant units sit outside the calculation altogether, which matters in markets with many second homes or empty properties. They do not pull the rate up or down.
In practice, “owner occupancy rate” and “homeownership rate” are used as near-synonyms. The Census Bureau’s own homeownership rate uses the same formula: owner-occupied units divided by occupied units.
Rate of units versus share of adults
A unit-based rate can look high next to a person-based one. The Minneapolis Fed’s homeowners-to-population data makes the point that the standard rate measures housing units, not the percentage of adults who personally own homes.
Based on 2024 ACS data, the Minneapolis Fed’s measure put the U.S. figure at 53%, against the commonly cited 65%. That method counts the reference person and a spouse or unmarried partner as owners when they live in an owner-occupied unit. Other adults in the home, such as grown children or roommates, are not counted as owners.
Neither number is wrong. They answer different questions. For investors, the unit-based rate is the more relevant one, because you buy and rent units, not people.
How to calculate the owner occupancy rate
The formula is simple:
Owner occupancy rate = (owner-occupied units ÷ occupied units) × 100
Here is a worked example with made-up numbers for a small ZIP code:
- The ZIP has 1,000 housing units in total.
- 80 are vacant, so 920 are occupied.
- Of those 920, 575 are owner-occupied and 345 are rented.
- The rate is 575 ÷ 920 × 100 = 62.5%.
Notice that the 80 vacant units never enter the formula. If you divided by all 1,000 units, you would get 57.5%, which is a different and misleading number. Always divide by occupied units.
The renter share is simply the remainder: 100% minus 62.5% is 37.5%. That is the pool of tenants your rental would draw from.
Where to find U.S., Florida and Texas figures
The Census Bureau publishes most of the reliable data, and different products serve different needs.
National benchmark
The Census Bureau’s 2023 ACS report estimated 85.7 million owner-occupied units out of 131.3 million occupied units, a 65.2% rate. QuickFacts reports the same 65.2% for the 2020–2024 period. Rates also move with the cost of financing, so many investors read the national figure next to a U.S. mortgage rate forecast when judging whether buyers or renters are likely to gain share.
State and metro tables
For current state and large-metro figures, the Census Bureau’s Housing Vacancies and Homeownership survey is the place to look. Its rates page listed 2026 tables for states and the 75 largest metropolitan areas when we checked, plus a historical series that starts in 2005.
For small areas, the American Community Survey is the tool. It provides estimates from the national level down to the block-group level, but not for individual blocks because of confidentiality and reliability limits. ZIP, tract and county pages on free data sites are built from this survey.
Florida and Texas compared
Different sources give slightly different numbers for the same state, because they use different surveys and years. This is the pattern to expect:
| Geography | Rate | Period and source |
|---|---|---|
| United States | 65.2% | 2020–2024, Census QuickFacts |
| Texas | 62.6% | 2020–2024, Census QuickFacts |
| Texas | 62.3% | 2024, state comparison table |
| Florida | 68.0% | 2024, state comparison table |
| California | 55.8% | 2024, state comparison table |
The two Texas lines are a good lesson. They differ by 0.3 points because one is a five-year average and the other is a single-year estimate. Neither is an error.
Inside Florida, the gap between counties is wide. The 2024 county table shows Miami-Dade at about 55.1% and Sumter County at about 87.0%. The same table lists Broward at roughly 64.4%, Duval at 61.4% and St. Johns at 83.7%. These are population-based measures, so read them as a guide to relative position, not as unit-based rates. A statewide number of 68.0% tells you very little about whether a given Miami-Dade or Sumter County neighborhood suits a rental.
For Dallas–Fort Worth wholesalers, the same logic applies. Pull the metro figure for context, then drop down to county and ZIP level. Local profile pages usually name their comparison geography and data year, and you should note both every time.

How accurate is the owner occupancy rate?
The rate is a survey estimate, so it carries sampling and nonsampling error. The ACS draws on an annual sample of more than 3.5 million housing-unit addresses, and the Census Bureau publishes margins of error with its estimates. Adding and subtracting the margin of error gives a range that is expected to contain the true value with 90% confidence.
An illustration: a tract shows 58% with a margin of error of 6 points. The real rate is likely between 52% and 64%. If a neighboring tract shows 61%, you cannot say it is more owner-heavy.

Check the data vintage
Three habits protect you from misreading the numbers:
- Know it is a period estimate. ACS 5-year figures represent data collected over a 60-month period, not a snapshot of one day or month.
- Be careful with year-over-year changes. Consecutive 5-year estimates share much of the same sample, and the Census Bureau urges extreme care when comparing them. A one-point rise between releases is often noise.
- Match vintages when comparing. QuickFacts specifically advises caution when comparing 2020–2024 estimates with other ACS estimates.
Small geographies are the weakest. Smaller areas get their annual figures by averaging over the current year and several previous years, so a neighborhood that changed quickly may look older than it is.
What the rate can and cannot tell an investor
The rate is context. It describes the mix of owners and tenants in an area. It does not describe any one house, street or deal.
What it can tell you
- Renter depth. A lower owner occupancy rate means a larger share of households rent, which suggests a deeper tenant pool for a buy-and-hold rental.
- Neighborhood character. Areas with high owner occupancy often have more resident owners maintaining their homes, which can matter when you are choosing comps for a flip.
- Trend direction over many years. A long run of rising or falling rates, read across several non-overlapping periods, shows where an area is heading.
- Which buyer you are selling to. For a flip, an owner-heavy area points to owner-occupant buyers. That can shape your finish level and your exit price.
What it cannot tell you
- Whether a specific property is owner-occupied or absentee-owned. The area rate is an average. A 75% owner-occupied block still has 25% rentals and absentee owners.
- Rent levels or vacancy. Vacant units are excluded, so the rate says nothing about how easy it is to fill a unit. For that, look at absorption rate in housing.
- Cash flow. Rents, taxes, insurance and financing decide returns. Run those numbers in a rental property calculator.
- After repair value. Prices come from nearby sales, not from tenure mix. Use a proper ARV calculator with verified comps.
The practical path is to use the rate to shortlist markets, then move to property-level facts. If your strategy is direct-to-owner outreach, such as wholesaling to absentee owners, area averages are only a starting point. You need to know which individual properties are not owner-occupied.
A simple workflow for using the rate in your market research
- Pick the geography that matches your buy box. County or ZIP for a rental, metro for a market comparison.
- Pull the rate and its margin of error. Write down the data year and whether it is 1-year or 5-year.
- Compare against the state and the nation using the same source. Mixing sources muddies the comparison.
- Check the trend across non-overlapping periods. Skip consecutive 5-year releases.
- Layer on rents, vacancy and absorption. Tenure mix alone is never a go or no-go signal.
- Move to property-level data. Confirm owner status, mailing address and ownership length for each target.
- Run the deal. Use ARV, rehab and financing tools to test the numbers before you make an offer.
Perspective
We built Real Estate Investor Toolkit around a simple idea: investors lose money when they rely on one number for a decision that needs several. The owner occupancy rate is a good example. It is a respected Census measure, and it is useful, but it is an average across a geography.
That is why we pair area-level context with property-level detail. Our paid plan includes owner-occupancy details and owner and absentee owner data, so you can move from “this ZIP is 62% owner-occupied” to “this specific house is likely held by an out-of-area owner.” For wholesalers and landlords doing outreach, that second answer is the one that fills a pipeline.
We also think the free calculators should be where analysis starts. You can open an ARV, rehab or rental calculator without signing up, test a deal in minutes, and decide later whether you need unlimited reports and saved pipelines. Market statistics tell you where to look. Deal math tells you whether to buy.
Michael
Run the numbers on your next deal
Once you have picked a market, you can check a property’s numbers for free. Our free calculators cover ARV, maximum allowable offer, rehab costs and rental cash flow, with no sign-up required.
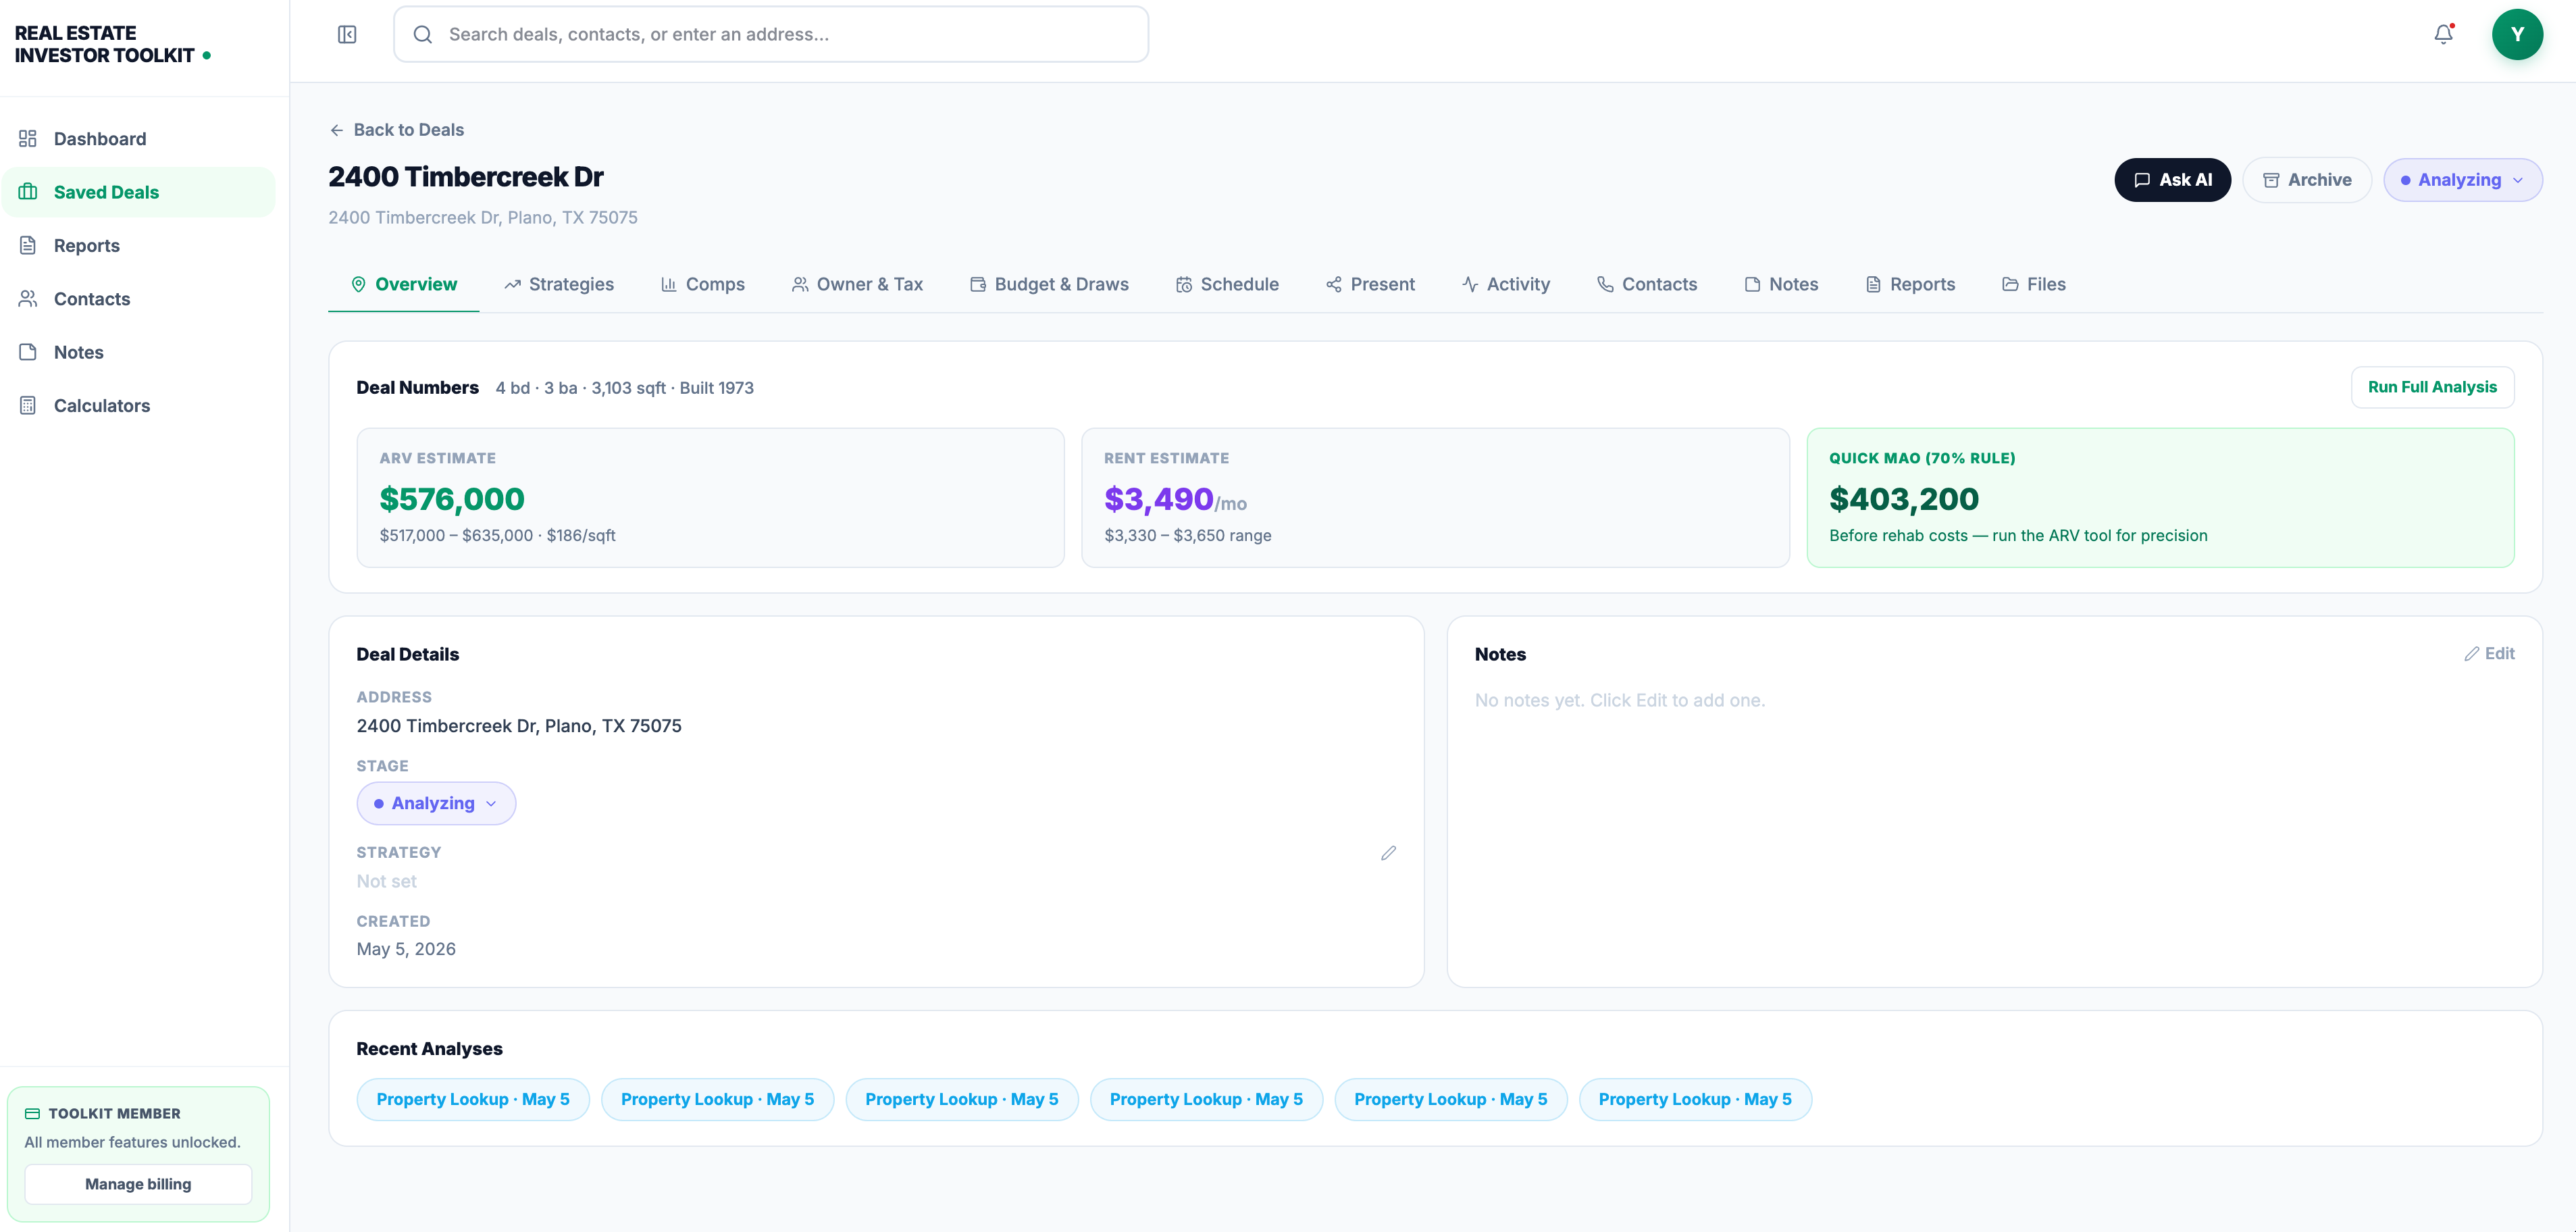
When you want unlimited reports, saved deal pipelines, owner-occupancy details and an AI assistant for deal insights, the Real Estate Investor Toolkit plan is $39.99 per month. You can see what is included on the pricing page. If you are still learning the metrics, our investing guides explain each one step by step.
FAQ
What counts as owner-occupied?
A housing unit is owner-occupied when the owner or a co-owner lives in it. It still counts if there is a mortgage, a land contract or another debt arrangement, or if the home is not fully paid for. Units that are occupied by renters are classed as renter-occupied.
Is the owner occupancy rate the same as the homeownership rate?
For most purposes, yes. The Census Bureau’s homeownership rate is owner-occupied units divided by occupied units. Both differ from the share of adults who own homes, which was estimated at 53% by the Minneapolis Fed’s measure using 2024 ACS data, against about 65% for the unit-based rate.
How accurate are local owner occupancy figures?
They are survey estimates with a margin of error, and smaller areas have wider margins. Check the margin of error, the data period and the geography before you compare two numbers. Avoid reading small differences between consecutive 5-year releases as real change.
Does a high owner occupancy rate mean a bad market for rentals?
Not necessarily. It means the renter share is smaller, so the pool of tenants is narrower in relative terms. Rents, vacancy, job growth and purchase prices decide whether a rental works, so run the deal in a cash flow calculator before you decide.
Where do I find the rate for my county or ZIP code?
Start with Census QuickFacts and the ACS tables for county, tract and ZIP-level figures, and the Housing Vacancies and Homeownership tables for states and large metros. Note the data year each time. Free data sites that repackage ACS data are convenient, as long as you read which geography and period they use.
Sources
- U.S. Census Bureau QuickFacts notes: owner-occupied housing unit rate
- Minneapolis Fed: Homeowners-to-Population Data
- Minneapolis Fed: New homeownership measure puts people first
- Census Bureau: Housing Availability and Affordability 2023
- Census Bureau: Homeownership Rate Fact Sheet
- Census Bureau: Housing Vacancies and Homeownership rates
- Census QuickFacts: United States
- Census QuickFacts: Texas
- Census ACS release dates and notes (ALFRED)
- FRED: Annual Homeownership Rate by Location, Florida
- III: Homeownership rate by state archive