35–45% Benchmarks: Rental Operating Expense Ratio for Investors

The operating expense ratio (OER) equals total operating expenses divided by effective gross income (EGI). It measures how much of a rental property’s income gets consumed by running the property. The ratio excludes debt service, depreciation, and capital expenditures, since those live outside day-to-day operations.
TL;DR:
- A typical residential rental property’s operating expense ratio ranges from 35% to 45%, with lower numbers often indicating missed expenses rather than better deals.
- Operating expenses include property taxes, insurance, management, maintenance, utilities, HOA dues, and advertising, but exclude debt service, capital expenditures, and depreciation.
- Variations in lease structures, such as gross or triple-net leasing, significantly affect the operating expense ratio and should be considered when comparing properties.
- Running the OER annually provides a more accurate reflection of management trends and avoids misleading spikes caused by irregular or one-time costs.
- Using a rental calculator helps quickly assess how changes in vacancy, management, or utilities impact the OER during property evaluation.
Table of Contents
- What Is the Operating Expense Ratio Rental Formula?
- Which Expenses Count Toward Operating Expense Ratio Rental Calculations?
- What OER Range Should You Expect by Property Type?
- How Do You Read OER Alongside NOI and Cap Rate?
- What Mistakes Distort Operating Expense Ratio Rental Numbers?
- How Can You Lower OER Without Cutting Corners?
- How Do You Model OER Using Real Estate Investor Toolkit Calculators?
- When Should You Question a Seller’s OER Numbers?
- Try the Real Estate Investor Toolkit Rental Calculator
- Sources
What Is the Operating Expense Ratio Rental Formula?
The formula is straightforward: OER = Total Operating Expenses ÷ Effective Gross Income. The hard part is getting EGI and your list of expenses right.
Start with EGI. Take your potential gross rent, add any other income (laundry, parking, pet fees), then subtract vacancy and credit loss. That final number, not gross scheduled rent, is your OER denominator.
Here’s a worked example using monthly figures for a single-family rental:
- Potential gross rent: $2,000/month ($24,000/year)
- Other income: $0
- Vacancy and credit loss (5%): subtract $1,200/year
- Effective gross income: $22,800/year
- Total operating expenses (taxes, insurance, maintenance, management, utilities): $9,000/year
- OER = $9,000 ÷ $22,800 = 39.5%
Run the math annually whenever possible. Monthly snapshots swing wildly because a single repair invoice or an annual insurance premium can spike one month’s ratio without reflecting the property’s real trend.
Which Expenses Count Toward Operating Expense Ratio Rental Calculations?
Line-item clarity is what makes an OER comparable across properties. Recurring operating expenses typically include:
- Property taxes and landlord insurance premiums
- Routine maintenance and repairs (not major system replacements)
- Property management fees
- Owner-paid utilities (water, trash, common-area electric)
- HOA dues, advertising costs, business licenses, and pest control
Everything above hits your income statement in the year it’s paid. What stays out of the numerator matters just as much:
- Mortgage principal and interest (debt service)
- Capital expenditures like a new roof or HVAC system
- Depreciation
- Owner draws or distributions
Statistic Callout: Small residential rentals commonly land in a 35% to 45% OER range once every recurring cost is properly counted. If your number sits well below that, you’ve probably missed a line item, not found a bargain.
The IRS Schedule E framework draws this same line for tax purposes: ordinary and necessary expenses to produce rental income are deductible in the current year, while items that add value to the property get capitalized and depreciated instead. Aligning your OER buckets with Schedule E buckets makes your numbers audit-ready and comparable to how lenders underwrite the same deal.
What OER Range Should You Expect by Property Type?
Benchmarks shift based on who pays for what, not just the building itself.
- Single-family rentals: typically 35% to 45%, with owners covering most costs
- Small multifamily (2 to 4 units): often have somewhat higher operating expense ratios, driven by shared systems and turnover
- Large multifamily (50+ units): commonly have elevated operating expense ratios, reflecting on-site staffing and amenities
- Industrial: frequently have lower operating expense ratios, since tenants usually cover taxes, insurance, and maintenance
- Retail (triple net or NNN): often have very low landlord operating expense ratios because tenants pay nearly everything
- Office: ranges widely in operating expense ratios, depending on how much the landlord covers under the lease
Lease structure is the single biggest driver of these swings. A gross lease shifts nearly every cost onto the landlord, while a triple-net lease pushes taxes, insurance, and maintenance onto the tenant. Comparing a gross-lease office building’s OER to a NNN retail strip’s OER tells you nothing useful. Local property tax rates, insurance markets, and building age also nudge ranges up or down, so always benchmark against similar assets in a similar market.
How Do You Read OER Alongside NOI and Cap Rate?
OER and NOI margin are two sides of the same coin. When you express both as a share of EGI, NOI margin equals 1 minus OER. A 40% OER means a 60% NOI margin, before debt service.

That relationship is only useful when you compare like with like. A 35% OER on a rent-controlled duplex with 1990s rents isn’t better than a 45% OER on a stabilized asset charging market rent. Low expenses paired with low income can still produce weak cash flow and cap rate numbers.
Deferred maintenance is the classic trap. A seller who skipped repairs for three years shows an artificially low OER right up until the roof fails and the new owner eats a five-figure capital bill. OER tells you what a property costs to run today. It says nothing about what it will cost to run once you fix what the previous owner ignored.

What Mistakes Distort Operating Expense Ratio Rental Numbers?
Most bad OER calculations trace back to a handful of repeat offenders:
- Using potential gross rent instead of EGI, which understates the ratio by ignoring vacancy and credit loss
- Skipping a management line entirely when self-managing, which hides the real cost of running the property
- Classifying a capital expenditure (new roof, full renovation) as a routine operating expense
- Trusting a seller’s profit-and-loss statement without reconciling it against their tax Schedule E
That second point deserves emphasis. If you self-manage, your labor still has a market value, and leaving it out makes your OER look artificially efficient compared to a professionally managed comp.
Pro Tip: Ask every seller for their Schedule E alongside their marketing P&L. If the two don’t roughly match, the marketing version is hiding something, and it’s usually an expense line, not a revenue one.
How Can You Lower OER Without Cutting Corners?
Optimizing OER isn’t about starving the property. It’s about spending smarter on the same upkeep.
- Rebid vendor contracts annually and bundle landscaping, snow removal, or pest control across multiple properties for volume pricing
- Install submeters or shift utility billing to tenants where local law allows it
- Run a preventative maintenance schedule so small issues get fixed before they become expensive emergency repairs
- Shop insurance every renewal rather than auto-renewing, and add ancillary income like laundry, storage, or parking fees to grow EGI
- Track vendor performance against a simple KPI, like average repair turnaround time, to catch overbilling early
A bookkeeping system built for rental owners makes these categories easier to track consistently, which matters more than any single cost cut.
How Do You Model OER Using Real Estate Investor Toolkit Calculators?
Every input in the formula maps directly to a field in a rental property calculator: rent and other income build your EGI, vacancy percentage adjusts it down, and each expense line (taxes, insurance, management, maintenance, utilities) feeds the OpEx total.
Scenario testing is where the calculator earns its place in your workflow:
- Add an 8% to 10% management fee to see how OER shifts when you stop self-managing
- Bump vacancy from 5% to 8% and watch OER rise even though nothing about your expenses changed
- Shift water and trash billing to tenants and watch OER drop without touching rents
Save each scenario and revisit it quarterly. Tracking OER over time, on the same property, tells you far more than any single snapshot, and the calculators require no sign-up for a quick run.
When Should You Question a Seller’s OER Numbers?
A suspiciously low OER, anything well under the typical range for that property type, is the first thing that makes me dig deeper. Before I trust a seller’s number, I ask for the Schedule E, twelve months of bank statements, and vendor invoices for major repairs. Reconcile the marketing P&L against the tax return, because the gap between them usually reveals the expense line someone quietly left off.
— Michael
Try the Real Estate Investor Toolkit Rental Calculator
A rental property calculator gives you a faster way to stress-test OER than rebuilding a spreadsheet formula every time a deal changes. Plug in rent, vacancy, and your expense stack, and the rental property calculator computes OER alongside cash flow and cap rate in the same pass, with no sign-up required to run the numbers.
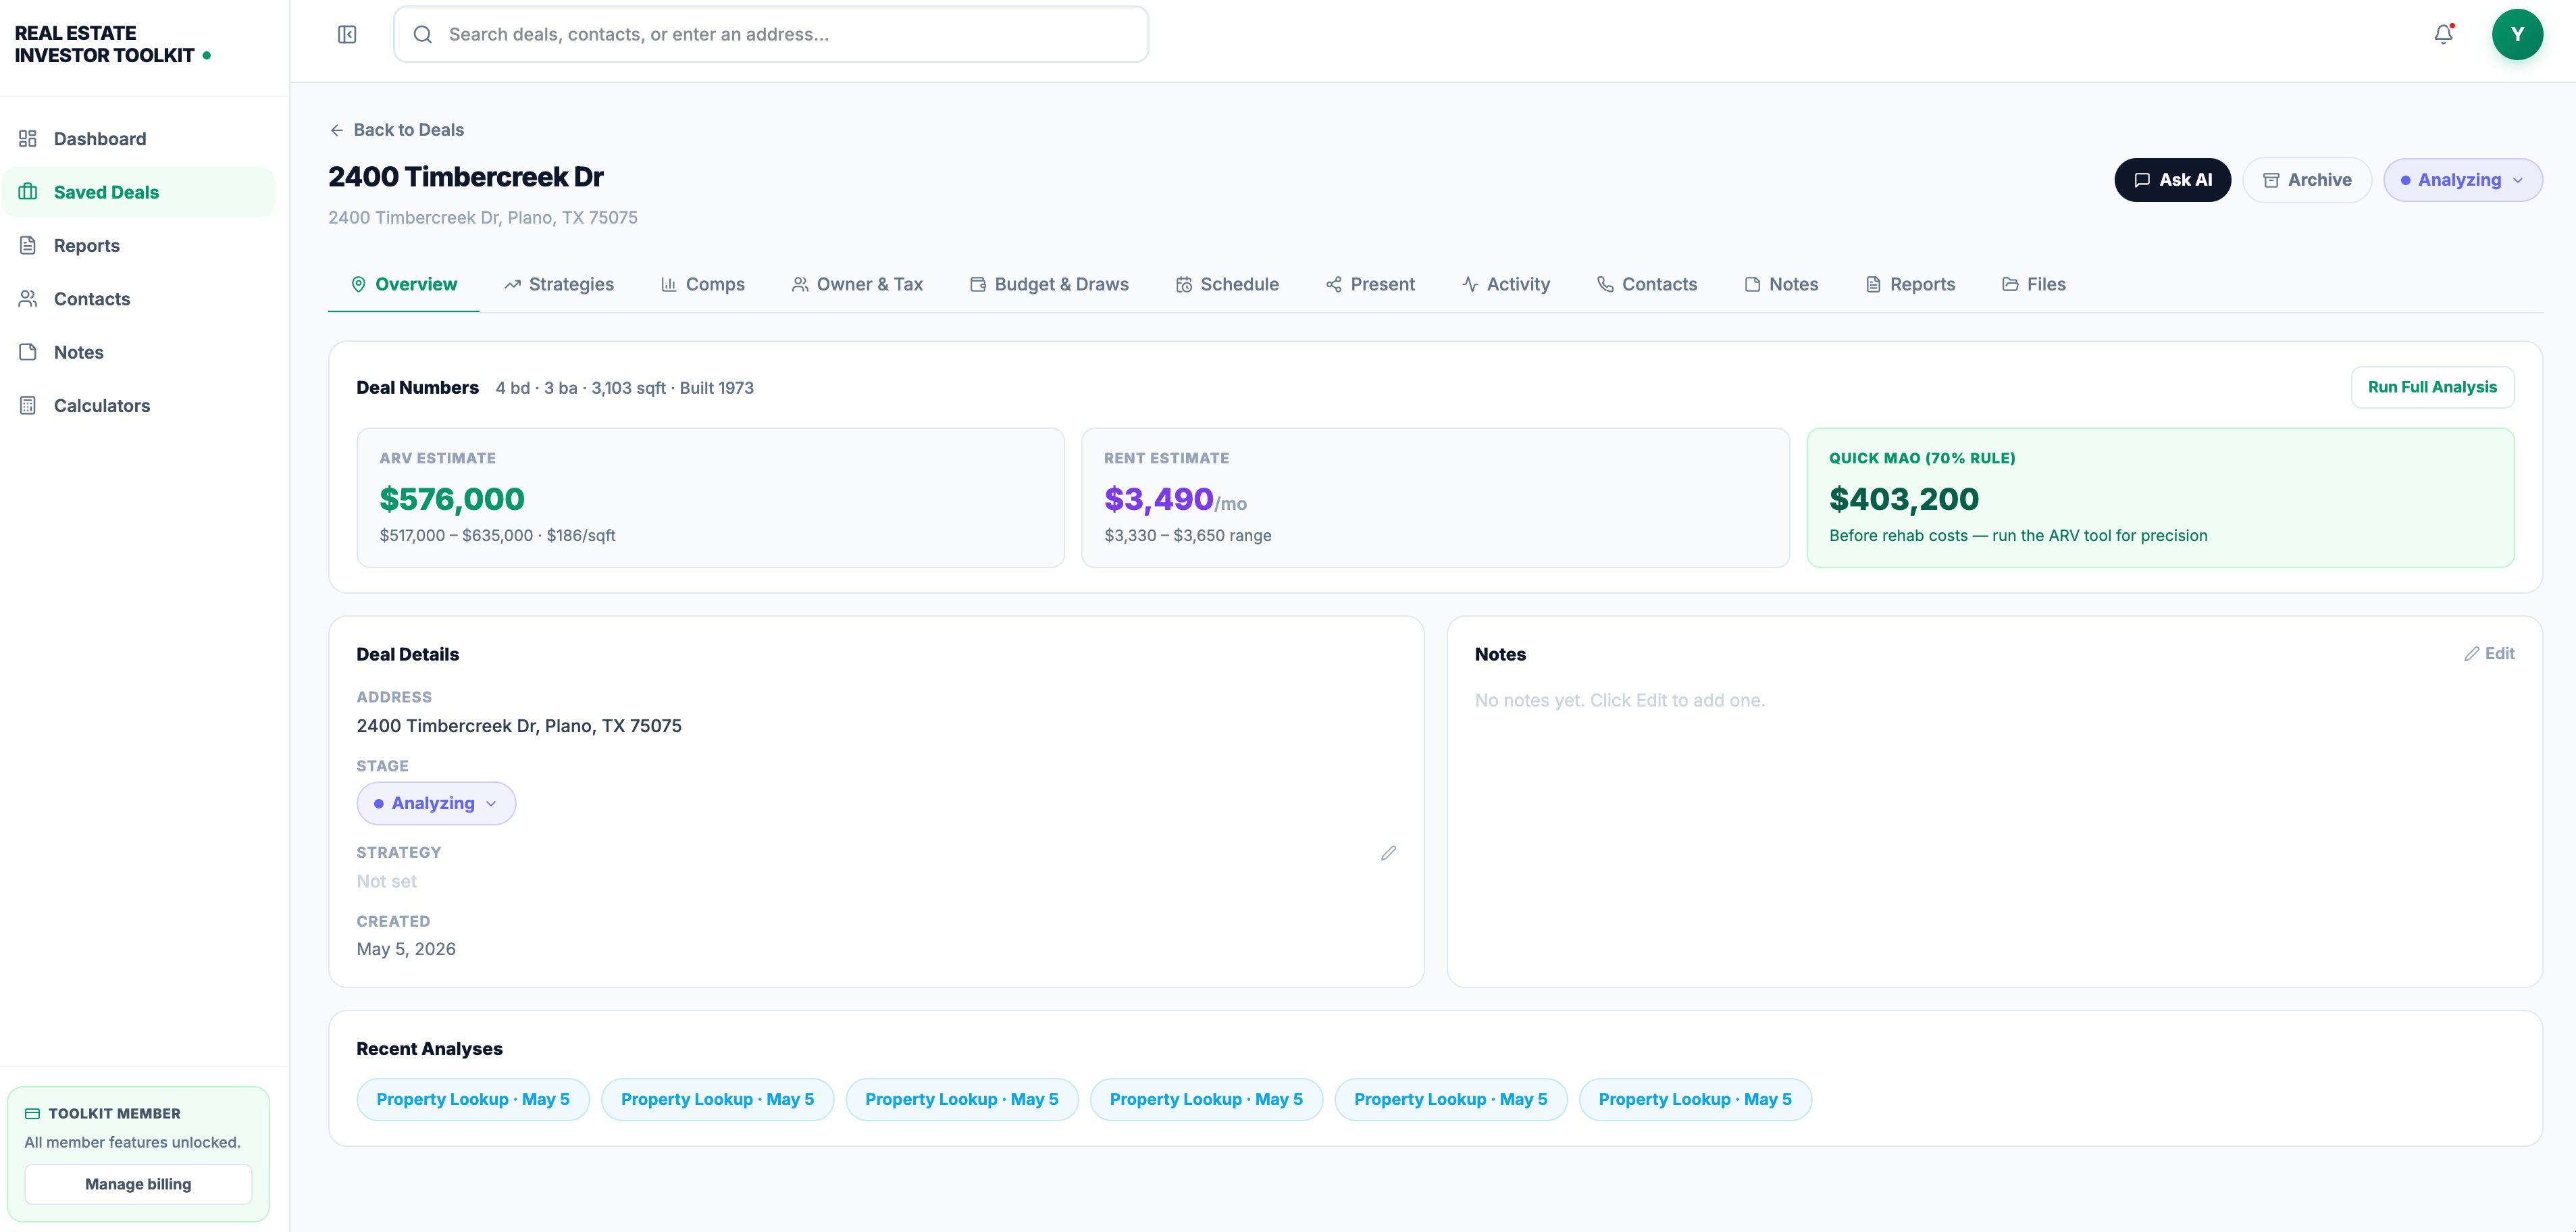
That matters most when you’re comparing three or four properties in a single afternoon and don’t have time to rebuild formulas from scratch for each one. Save your scenarios, adjust vacancy or management assumptions as new information comes in, and watch how each change moves the ratio before you write an offer. Start with the rental calculator on your next deal, or browse the investing guides if you want to brush up on how OER fits into the rest of your underwriting checklist first.
Sources
For the formula and exclusions, Investopedia’s OER breakdown is the clearest reference. For tax classification of landlord expenses, go straight to the IRS Schedule E guidance. For real-world benchmark ranges, rents.ai’s operating expense guide is worth a read. For a quick sanity check on your own numbers, try the OER calculator at rentalrealestate.com.