NOI Calculation for Real Estate Investors: Formula and Examples

Net operating income (NOI) equals Effective Gross Income (EGI) minus total operating expenses — and it measures a property’s unlevered, pre-tax operating yield before any financing costs touch the numbers. Run the full sequence: start with Potential Gross Income (PGI), subtract vacancy and credit loss, add ancillary income to get EGI, then subtract every operating expense to land on NOI.
Key exclusions you must keep below the NOI line:
- Debt service (mortgage principal and interest)
- Income taxes on the owner’s return
- Depreciation and amortization
- Capital expenditures (roof replacements, HVAC systems, major renovations)
- Tenant improvements and leasing commissions
Those items vary by owner, financing structure, or tax position — none of them reflect the property’s operating performance, which is exactly what NOI is designed to isolate.
Key Takeaways
Accurate NOI calculation requires the right formula, clean inputs, and a clear understanding of what belongs above and below the NOI line.
| Point | Details |
|---|---|
| Core NOI formula | NOI = Effective Gross Income − Operating Expenses; EGI = PGI − Vacancy + Other Income. |
| Critical exclusions | Debt service, income taxes, depreciation, CapEx, and leasing commissions never belong above the NOI line. |
| Cap rate and DSCR | Divide NOI by property value for cap rate; divide NOI by annual debt service for DSCR (target: 1.20x–1.25x minimum). |
| Normalize before you trust | Reset vacancy to market rate, normalize management fees, and remove non-recurring items before finalizing NOI. |
| Real Estate Investor Toolkit | The free Rental Property Calculator converts NOI inputs into cap rate, cash-on-cash, and DSCR in one pass. |
Table of Contents
- What is NOI and why does it matter for investors and lenders?
- How to calculate NOI: the formula and its components
- What should you never include in an NOI calculation?
- Step-by-step NOI calculation example
- How investors and lenders use NOI in deal analysis
- What does a good NOI margin look like by asset class?
- Common mistakes that distort your NOI
- How to use an NOI calculator efficiently
- The part of NOI analysis most investors skip
- Real Estate Investor Toolkit puts NOI, cap rate, and DSCR in one place
- Sources
What is NOI and why does it matter for investors and lenders?
NOI strips out financing and ownership variables so you can evaluate a property’s performance on its own merits. Morgan](https://www.jpmorgan.com/insights/real-estate/commercial-term-lending/calculating-net-operating-income-and-cash-flow) states the primary goal is to assess the asset independent of ownership structure or debt financing, giving investors a clean apples-to-apples comparison across different properties and markets.
Lenders and investors rely on NOI for three core applications:
- Cap rate valuation: NOI ÷ market cap rate = estimated property value (or cap rate = NOI ÷ purchase price)
- DSCR underwriting: Debt Service Coverage Ratio = NOI ÷ annual debt service; lenders typically require a minimum of 1.20x–1.25x
- Debt yield: NOI ÷ loan amount; a common lender target falls in the 9%–10% range
- Portfolio aggregation: Sum NOI across assets to measure total portfolio yield without distortion from different capital structures
Because NOI excludes financing, two investors who bought the same building at different loan-to-value ratios will report the same NOI. That consistency is what makes it the standard input for cap rate and cash-on-cash comparisons across the industry.
How to calculate NOI: the formula and its components
The calculation runs in three stages, as described in institutional underwriting convention:
Stage 1: Potential Gross Income (PGI)
Revenue items that build PGI:
- Base rent (in-place leases or market rents)
- Parking income
- Laundry and vending revenue
- Storage fees
- Cell tower or rooftop antenna leases
- Pet fees and other tenant fees
Stage 2: Effective Gross Income (EGI)
EGI = PGI − Vacancy & Credit Loss + Other Income
Rocket Mortgage notes that vacancy and credit loss factors of 5%–10% are commonly applied depending on market conditions and property type.
Stage 3: NOI
NOI = EGI − Total Operating Expenses
Operating expenses to subtract:
- Property taxes
- Property and casualty insurance (see commercial property insurance options for current premium benchmarks)
- Repairs and maintenance
- Property management fees (typically 8%–12% of collected rents)
- Utilities paid by the owner
- Payroll and contract labor
- Professional services (legal, accounting)
- Marketing and leasing costs
- General and administrative expenses
Monthly conversion: Divide annual NOI by 12. If annual NOI is $120,000, monthly NOI is $10,000. Lenders almost always underwrite on an annual basis, but monthly figures help you reconcile to a rent roll.
What should you never include in an NOI calculation?
Keeping the wrong items above the NOI line is one of the most common errors in deal analysis. J.P. Morgan’s underwriting guidance is explicit on this point.
- Debt service (P&I): Mortgage payments reflect your financing terms, not the asset’s performance. A buyer with 80% LTV and a buyer with 50% LTV own the same building; their NOIs must match.
- Income taxes: Tax liability depends on ownership entity, depreciation elections, and individual tax position — none of which belong in property-level analysis.
- Depreciation and amortization: These are non-cash accounting entries. Including them would understate NOI relative to actual cash generation.
- Capital expenditures: Replacing a roof or an HVAC system is an investment in the asset, not a recurring operating cost. CapEx belongs in a separate capital budget or below the NOI line as a cash flow adjustment.
- Tenant improvements (TIs) and leasing commissions: These are deal-specific costs tied to lease execution, not ongoing operations.
A note on lease structure: In a gross lease, the landlord pays most operating expenses, so those costs appear directly in your NOI calculation. In a triple-net (NNN) lease, the tenant reimburses taxes, insurance, and maintenance — which means your operating expense line shrinks, but so does the gross rent you collect. Always confirm which expenses are landlord-paid before building your expense stack.
Step-by-step NOI calculation example
Here is a worked example for a 20-unit multifamily property with market rents of $1,500/month per unit.

Step 1: Calculate PGI 20 units × $1,500/month × 12 months = $360,000
Step 2: Apply vacancy and credit loss
$360,000 − $25,200 = $334,800
Step 3: Add other income Parking: $4,800 | Laundry: $2,400 | Total other income: $7,200 EGI = $334,800 + $7,200 = $342,000
Step 4: Subtract operating expenses, including property taxes, insurance, repairs, management fees, utilities, payroll, professional services, marketing, and general & administrative expenses, to calculate Total Operating Expenses and then the Net Operating Income (NOI).
Step 5: Monthly conversion $218,820 ÷ 12 = $18,235/month
T-12 vs. pro forma: If you pull the trailing 12-month (T-12) actuals from the seller’s books, you get in-place NOI. A pro forma NOI projects stabilized rents and normalized expenses. Lenders will rebuild their own underwritten NOI from both, and the three numbers rarely match exactly. Reconciling that gap is a core underwriting skill.
How investors and lenders use NOI in deal analysis
Investopedia describes NOI as a pre-tax, pre-financing measure used as the numerator in cap rate calculations. Here is how that plays out in practice.
Cap rate and valuation
Cap Rate = NOI ÷ Property Value
The rental property calculator at Real Estate Investor Toolkit runs this math automatically alongside cash-on-cash and ROI.
DSCR and debt yield
DSCR = NOI ÷ Annual Debt Service
Limitations to keep in mind
NOI does not tell you how much cash you actually keep after debt service and taxes. It also does not reflect capital expenditure needs or the cost of major lease-up. Wall Street Prep points out that broker NOI and institutional NOI often diverge because of different treatments of non-recurring items and replacement reserves — a gap that directly moves cap-rate and valuation expectations. Always ask how the NOI was built before you rely on it.
What does a good NOI margin look like by asset class?
NOI margin = NOI ÷ EGI. It tells you what percentage of collected income survives after operating expenses — a useful efficiency ratio when comparing properties of different sizes.
Directional ranges by asset class (these are market-dependent and should be validated against local comps):
- Multifamily: Typically 55%–70% NOI margin; well-managed properties in low-expense markets can push higher
- Industrial / warehouse: Often 70%–80%, driven by NNN lease structures that shift most expenses to tenants
- Retail (NNN): Similar to industrial when leases are truly triple-net; gross-lease retail can drop to 50%–60%
- Office: Wider variance, often 50%–65%, with higher management and janitorial costs pulling margins down
A note on benchmarks: No single NOI margin threshold defines a “good” deal. A 60% margin in a high-cap-rate secondary market may outperform a 72% margin in a compressed primary market. Always benchmark against local peer comps and current market cap rates rather than national averages.
Use the rental analysis guide to see how NOI margin connects to cash-on-cash return and cap rate interpretation in a full deal model.
Common mistakes that distort your NOI
Getting the formula right is straightforward. Getting the inputs right is where most errors happen.
Frequent mistakes:
- Including capital expenditures above the NOI line. A new roof is not an operating expense. Put it in your CapEx budget and model it separately using a rehab cost estimator.
- Double-counting reserves. Some investors add a replacement reserve line to operating expenses AND include actual CapEx. Pick one convention and apply it consistently.
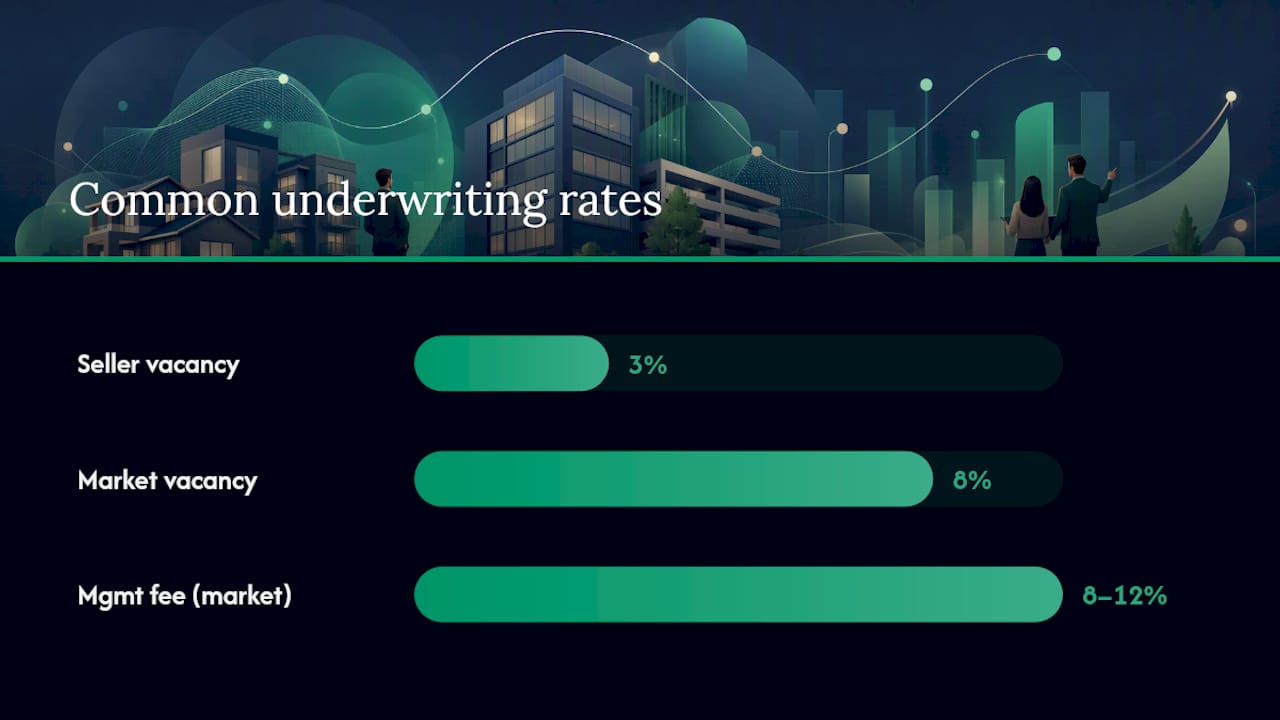
- Using the seller’s vacancy assumption without checking it. A seller may show 3% vacancy on a property in a market where 8% is the norm. Always verify against local absorption data.
- Understating management fees. Self-managed properties should still include a market-rate management fee (typically 8%–12%) so the NOI reflects what a third-party operator would cost.
- Accepting non-recurring income as stabilized. A one-time lease termination fee or insurance reimbursement inflates NOI if left in the revenue line.
Normalization checklist lenders commonly run:
- Reset vacancy to market vacancy (not in-place occupancy)
- Normalize management fees to market rate
- Remove non-recurring income and one-time expense credits
- Apply replacement reserves if institutional convention requires (often $200–$350/unit/year for multifamily)
- Verify property tax at post-sale assessed value, not the seller’s current bill
Pro Tip: Rebuild NOI from the rent roll and vendor invoices, not from the offering memorandum. Pull each lease to confirm in-place rent, then match each expense line to an actual invoice or tax bill. The gap between OM NOI and your rebuilt NOI is your negotiating data.
Institutional underwriting convention, as noted by Apers.app, places replacement reserves below the NOI line, while broker offering memorandums often exclude them entirely.
How to use an NOI calculator efficiently
A good NOI calculator accepts line-item inputs and returns EGI, total operating expenses, NOI, and NOI margin in one pass. Janover’s NOI calculator is a solid free option that breaks inputs down by line and shows how adjustments affect underwriting metrics.
Inputs to enter:
- Potential Gross Income (total units × monthly rent × 12)
- Vacancy and credit loss percentage
- Other income (parking, laundry, fees)
- Each operating expense line separately (taxes, insurance, maintenance, management, utilities, payroll, professional services, marketing, G&A)
Running a sensitivity analysis:
- Enter your base-case inputs and record the NOI and cap rate
- Increase vacancy from 5% to 10% and note the NOI change
- Raise the management fee from 8% to 10% and record the delta
- Test a 1-point cap rate shift (e.g., 6.0% to 7.0%) to see the valuation impact
- Combine the stress scenarios to find your downside NOI
That last step is where deals get made or passed on. If it doesn’t, you either reprice or walk.
The Investment Property Financing Calculator at Real Estate Investor Toolkit lets you feed your NOI directly into a DSCR model to check lender sizing alongside your cash flow projections.
The part of NOI analysis most investors skip
Most guides treat NOI as a single number. In practice, there are at least three NOIs on every deal: the seller’s T-12 in-place NOI, the sponsor’s pro forma NOI, and the lender’s underwritten NOI. Reconciling those three figures is where the real analysis happens, and most investors spend too little time on it.
The T-12 tells you what the property actually produced over the past year. The pro forma tells you what the sponsor believes it will produce at stabilization. The lender’s rebuild tells you what a conservative third party thinks is defensible. When all three are close, you have a well-underwritten deal.
The other thing worth watching: expense creep. Insurance premiums on commercial properties have risen sharply in recent years, and property tax reassessments after a sale can add tens of thousands of dollars to the annual expense stack. A NOI that looked solid at acquisition can erode quickly if you modeled expenses at the seller’s historical rates rather than at post-sale, post-reassessment levels.
Real Estate Investor Toolkit puts NOI, cap rate, and DSCR in one place
Running a clean NOI calculation by hand takes time. The Rental Property Calculator at Real Estate Investor Toolkit does it in minutes, with no sign-up required to get started.
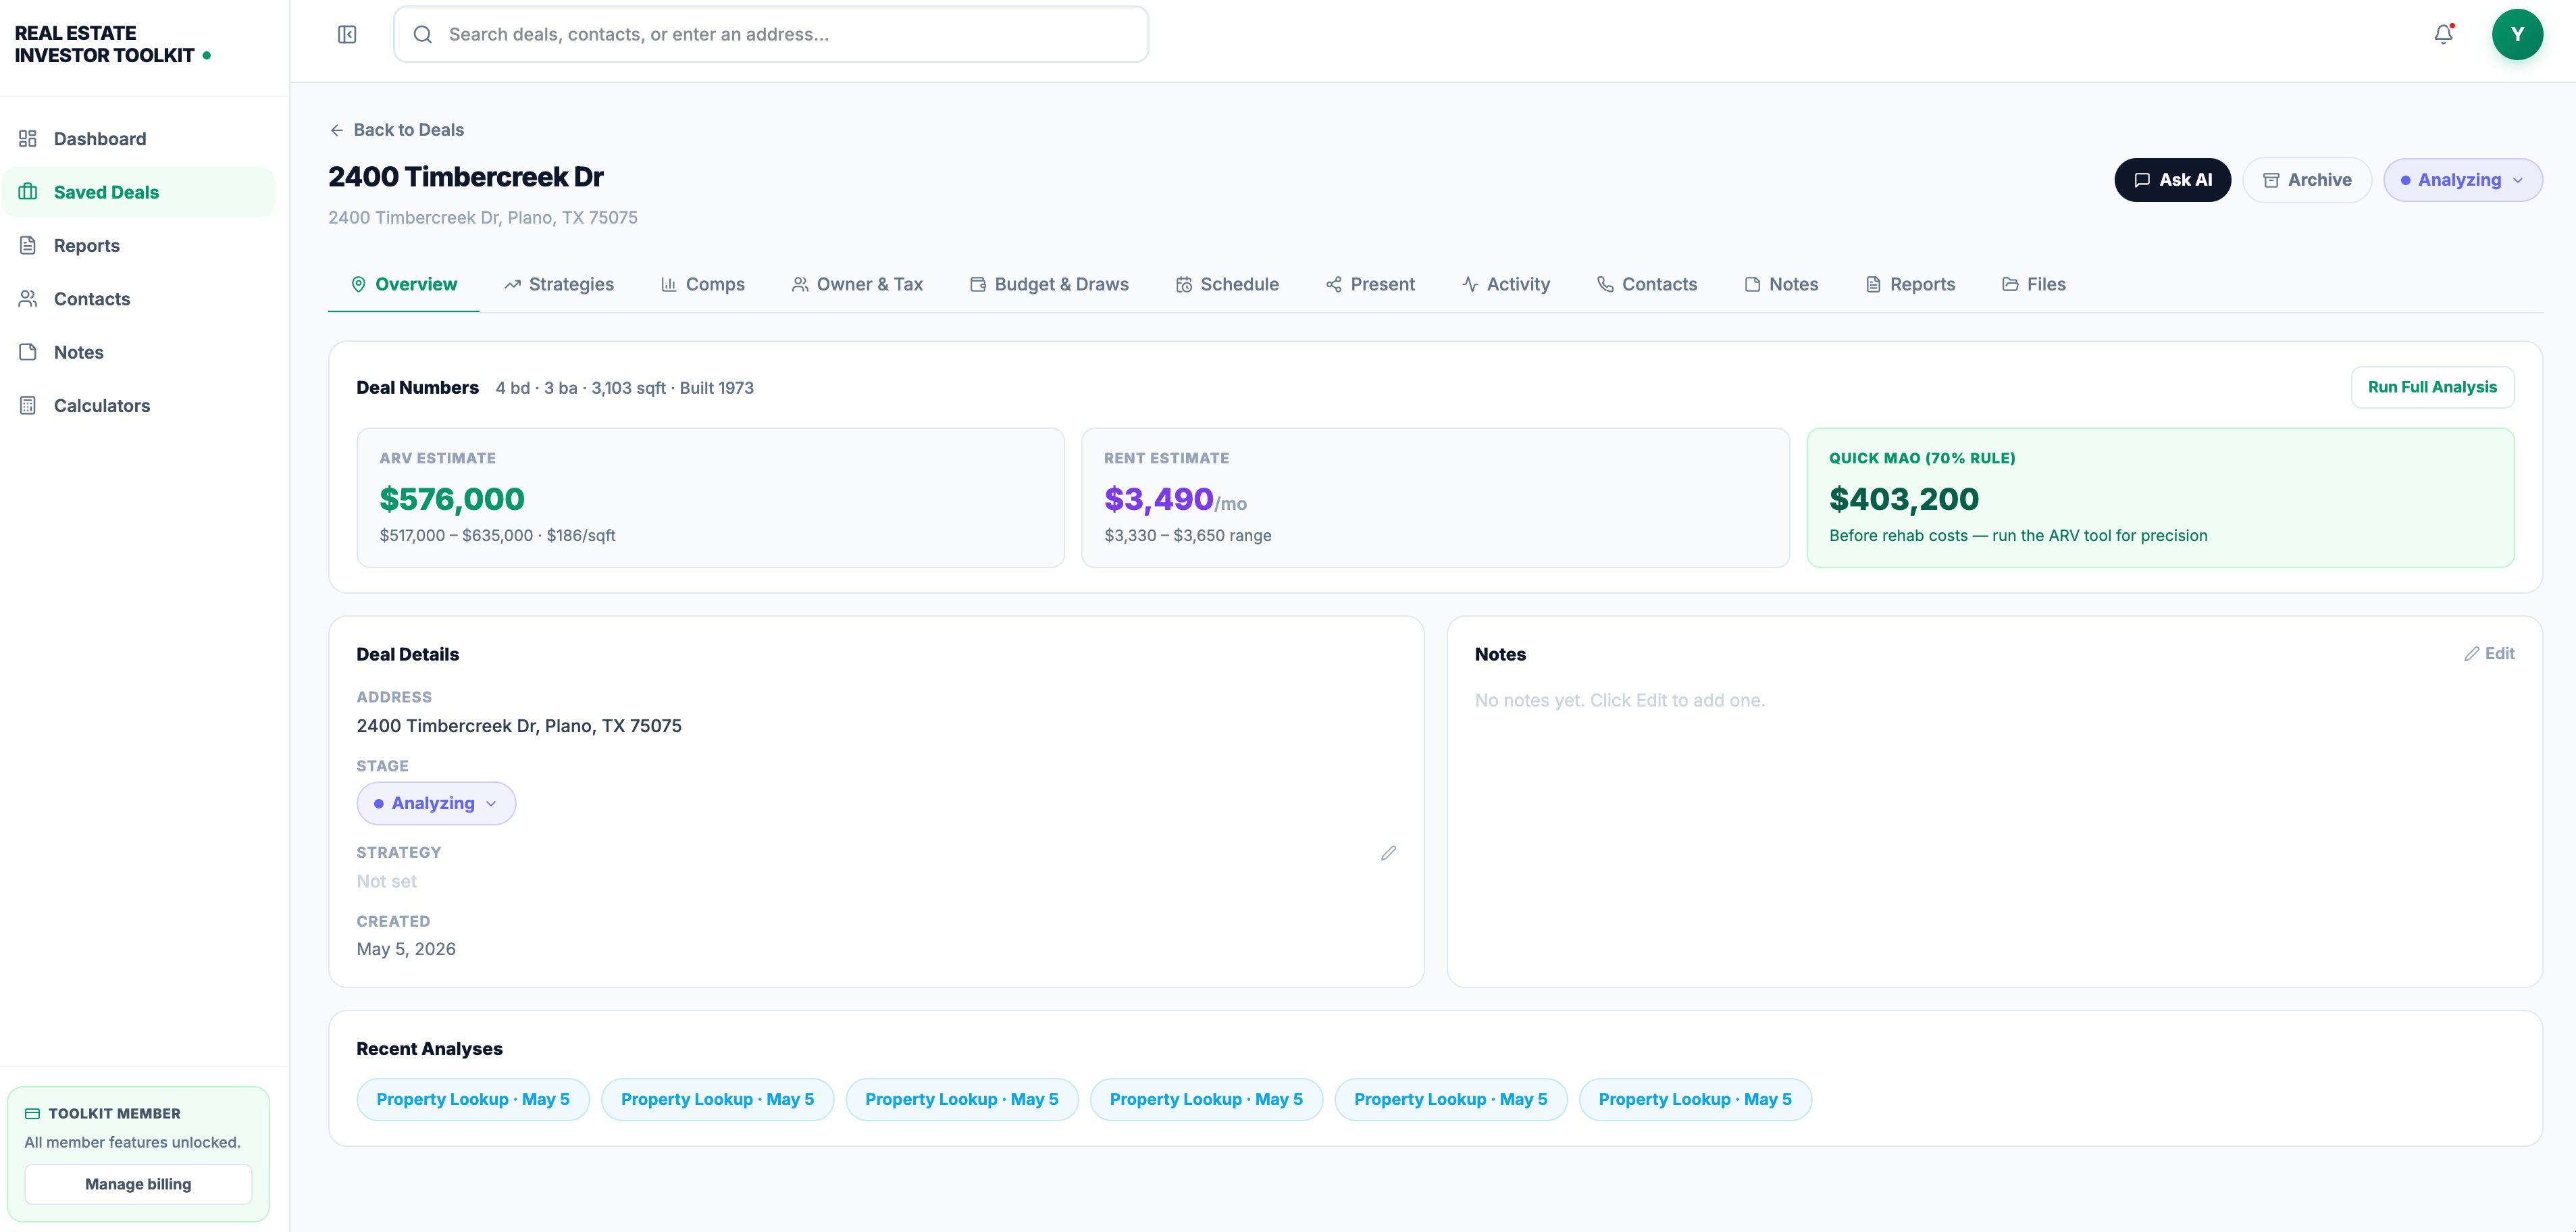
Enter your PGI, vacancy rate, other income, and each operating expense line, and the calculator returns EGI, total OpEx, NOI, cap rate, cash-on-cash return, and ROI in a single view. Toggle between monthly and annual figures, adjust vacancy or management fees to run a quick sensitivity, and feed the NOI output directly into the financing calculator to check DSCR against your target loan terms. Free calculators are available with no account needed; a paid subscription unlocks saved deal pipelines, advanced property data, and AI-assisted deal insights. Start with the free tools and investing guides to build your full underwriting workflow.
Sources
- Calculating net operating income and cash flow (J.P. Morgan)
- Net operating income (NOI) (Investopedia)
- Apers
- Net Operating Income (NOI) | Formula + Calculator (Wall Street Prep)
- Maximize Real Estate Profits: How to Calculate Net Operating Income (Rocket Mortgage)
When benchmarking your NOI, check your lender’s underwriting guidelines directly and pull local market comp data from a commercial broker or data provider. National averages are a starting point; your submarket’s actual vacancy rates and cap rates are what determine whether your NOI holds up at closing.