Loss to Lease Analysis: Formula, Examples and How to Use It

Loss to lease (LTL) is the gap between what an occupied unit could rent for at today’s market rate and what the tenant actually pays. To run the analysis, subtract in-place rent from market rent for each unit, add up the gaps, and express the total as a percentage of market rent. The harder part is deciding how much of that gap you can realistically collect, and when. This guide covers both.
TL;DR
- Dollar formula: loss to lease = market rent − in-place rent, calculated unit by unit, then totaled.
- Percentage formula: (market rent − in-place rent) ÷ market rent. Pick one denominator and use it everywhere, because mixed denominators make results incomparable.
- Opportunity, not a bill: LTL is rent you are not yet capturing. It is not cash you owe and it is not vacancy.
- Not automatic upside: the gap only turns into income as leases renew or roll over, and concessions, renewal terms and local rules slow that down.
- Best practice: show below-market gaps and above-market gains separately, and underwrite the timing.
Table of Contents
- What loss to lease means
- The loss to lease formulas
- Step by step: a loss to lease analysis on a six-unit building
- Why loss to lease matters when you buy
- Is the gap actually capturable?
- Adjust market rent for concessions
- From loss to lease to cash flow
- Loss to lease on single-family and small rentals
- Our perspective
- Run your numbers with the toolkit
- FAQ
- Sources
What loss to lease means
Loss to lease describes occupied units that rent below the current market. A long-term tenant who signed at $1,150 while similar units now ask $1,300 creates a $150 monthly gap. The same thing happens when market rents climb faster than your leases reset.
Two points keep the concept clean:
- It is an opportunity measure. The rent is simply uncaptured. You do not owe it to anyone, and it does not show up as a cash expense.
- It is not vacancy. LTL applies to units that are leased at a below-market rate. Vacancy applies to units producing no rent at all. Professional guidance on reporting rent roll losses treats below-market rent as a separate line from vacancy and collection loss, and your analysis should too.
A useful comparison: think of market rent as the menu price and in-place rent as what a regular customer locked in last year. The difference is real, but you only earn it when the customer reorders at the new price.
The loss to lease formulas
There are two outputs you will want: a dollar amount and a percentage.
Dollar loss to lease
Loss to lease = market rent − in-place rent
The basic example is simple. A $1,000 market rent against $900 in-place rent gives a $100 monthly loss to lease. Multiply by 12 for the annual figure.
Percentage loss to lease
The most common property-level version divides the gap by market rent:
LTL % = (market rent − in-place rent) ÷ market rent
Some analysts instead divide market rent by in-place rent and subtract one, which answers a different question: how much would rent rise to reach market? Both are valid. They give different numbers, so label which one you used.
Take a single unit with $2,000 market rent and $1,820 in-place rent:
| Measure | Calculation | Result |
|---|---|---|
| Monthly dollar LTL | $2,000 − $1,820 | $180 |
| Annual dollar LTL | $180 × 12 | $2,160 |
| % of market rent | $180 ÷ $2,000 | 9.0% |
| Increase needed to reach market | $2,000 ÷ $1,820 − 1 | about 9.9% |
Same unit, two honest percentages. That is why a lender’s number and your number can disagree without either being wrong. Always ask which denominator sits behind a quoted LTL figure.
Step by step: a loss to lease analysis on a six-unit building
Property-level analysis starts with a rent roll and a defensible market rent for each unit. Here is a worked example. The figures are illustrative.
Step 1: List each unit’s in-place rent. Pull this from the signed leases, not from the seller’s summary.
Step 2: Set a market rent for each unit. Use comparable units of the same bedroom count, condition and location. Our guide to market rent estimate methods walks through five ways to price a rental.
Step 3: Subtract unit by unit. Do not average first. Averages hide the units that matter.
| Unit | In-place rent | Market rent | Gap |
|---|---|---|---|
| A | $1,150 | $1,300 | $150 |
| B | $1,200 | $1,300 | $100 |
| C | $1,275 | $1,350 | $75 |
| D | $1,400 | $1,400 | $0 |
| E | $1,250 | $1,400 | $150 |
| F | $1,425 | $1,400 | −$25 |
| Total | $7,700 | $8,150 | $450 |
Step 4: Total the gaps. Net monthly LTL is $450, or $5,400 a year.
Step 5: Convert to a percentage. $450 ÷ $8,150 = 5.5% of market rent. On an in-place basis, $450 ÷ $7,700 = 5.8%.
Step 6: Split gross loss from gain. Units A through E are below market by $475 combined. Unit F is above market by $25, which is a gain to lease. Netting them gives $450, but reporting both ($475 below, $25 above) shows you where the renewal upside sits and where you have exposure. If Unit F’s tenant leaves, you may re-lease at market and lose that $25.

Why loss to lease matters when you buy
In multifamily underwriting, LTL feeds your income projection. A meaningful gap can support a rent growth assumption as leases mature and reset. A near-zero gap tells you future growth has to come from the market itself, not from marking leases up.
It also shapes how you read a seller’s pro forma. If the pro forma assumes every unit earns full market rent from day one, it is counting income you do not yet have.
The lender side agrees. Freddie Mac’s multifamily appraisal guidance says that for an as-is stabilized value, potential income should reflect the existing rent roll plus vacant units at market rent, rather than automatically assuming 100% market rent on every unit. Existing leases and normal leasing friction create a persistent difference. Your model should reflect that too.

Is the gap actually capturable?
This is where most loss to lease analysis goes wrong. A gap on paper is not a return until you can collect it. Before you treat LTL as upside, check these:
- Lease expirations. Build a roll schedule. If half the gap sits in leases that expire in 18 months, that is slower than a building where most leases expire this year.
- Renewal terms. Long terms and fixed-rate renewal options can delay mark-to-market. A 2026 NAIOP article notes that these features can turn an apparent rent-growth opportunity into long-duration potential rather than near-term cash flow.
- Realizable rent versus market rent. The same article says rent gaps do not generate returns until they are captured through rollover, renewals or re-leasing, so underwriting should separate market rent from realizable rent and consider timing within your hold period.
- Comp quality. If your market rent is overstated, your LTL is overstated. Check that comps match in size, condition, amenities and submarket.
- Rent regulations. Some jurisdictions limit how much you can raise rent. Confirm local rules before you model a jump.
- Tenant quality and turnover cost. A big increase can push a good tenant out. Turnover means downtime, make-ready work and leasing costs, which can eat the gain.
- Deferred maintenance. Below-market units sometimes need work before they can command market rent. Price that in with a rehab cost calculator.
Phase increases instead of jumping to market
A large increase over a short period is hard to push through. Many owners step rents up at each renewal, so the gap closes over two or three cycles. In your model, spread the capture across the hold period instead of booking it all in year one.
Adjust market rent for concessions
Face rent can overstate what you collect. If a comparable unit advertises $1,400 with one month free on a 12-month lease, the effective rent is $1,400 × 11 ÷ 12, about $1,283 a month. Comparing a tenant paying $1,250 to $1,400 shows a $150 gap. Compared to the effective $1,283, the gap is only about $33.
Use effective rent for your market comparison, especially in a market where owners are offering free months or waived fees. Concessions you grant yourself can be tracked separately or folded into collection loss, depending on how you report. Pick one method and apply it consistently. If you invest across borders or use rent assumptions to size borrowing, a broader set of finance checks for rentvesting can help you test how those rent figures feed into your lending position.
From loss to lease to cash flow
LTL sits above the cash flow line. The chain looks like this:
- Gross potential rent at market
- Less: loss to lease (occupied units below market)
- Less: vacancy
- Less: concessions and collection loss
- Equals effective gross income
- Less: operating expenses
- Equals net operating income (NOI)
A Forbes Real Estate Council article notes that LTL appears on the income statement and can flag a possible rent-raising opportunity, but that opportunity depends on whether the property can produce higher cash flow. In plain terms: LTL tells you where to look, and your operating numbers tell you whether it pays.
To see the effect on your returns, rerun the deal with only the portion of the gap you expect to capture in year one. Our rental property calculator shows cash flow, cap rate and ROI from your rent inputs, and our guide to how to analyze a rental property covers the rest of the underwriting. If you are still pricing the rent itself, rental yield calculation is a good next step.
A quick sensitivity check
Using the six-unit example, run three cases on the $5,400 annual gap:
| Scenario | Share of gap captured in year one | Added annual rent |
|---|---|---|
| Conservative | 25% | $1,350 |
| Base | 50% | $2,700 |
| Full mark-to-market | 100% | $5,400 |
If the deal only works under the full mark-to-market case, the price depends on an assumption that may take years to play out. If it works in the conservative case, any capture beyond that is a margin of safety.
Loss to lease on single-family and small rentals
You do not need a 200-unit complex for this analysis to be useful. With a duplex, fourplex or a small single-family portfolio, one unit at $180 below market is a $2,160 yearly gap, which may be a meaningful share of your cash flow. The process is the same: confirm in-place rent from the lease, estimate market rent from comps, take the difference, and note when the lease ends.
On BRRRR deals, the gap works in your favor from the start. After rehab you set rent at market, so in-place rent equals market rent on day one. Later, as rents rise and leases roll, LTL becomes something to watch. Our BRRRR calculator models the refinance and rent side of the strategy, and the BRRRR method guide explains each step.
Our perspective
Most investors we talk to can quote market rent for their area. Far fewer can tell you what each of their units actually pays, and when each lease ends. That is the real loss to lease analysis: a unit-by-unit rent roll, a market rent you can defend, and a timeline for closing the gap.
We built Real Estate Investor Toolkit around that idea. Deal analysis should be fast, grounded in verified market data, and easy to repeat on every property you look at. Our free calculators need no sign-up, so you can test a rent assumption in a minute. When you want unlimited reports, saved deal pipelines and an AI deal advisor in one place, the paid plan is designed to replace several separate subscriptions.
Our advice is to always underwrite two numbers: the rent the market says you could earn, and the rent you expect to collect in the next 12 months. The distance between them is where good decisions get made.
Michael
Run your numbers with the toolkit
You can start with our free calculators, no sign-up required. Plug in your in-place and market rents, check cash flow and cap rate, and see how a partial capture of the gap changes your returns.
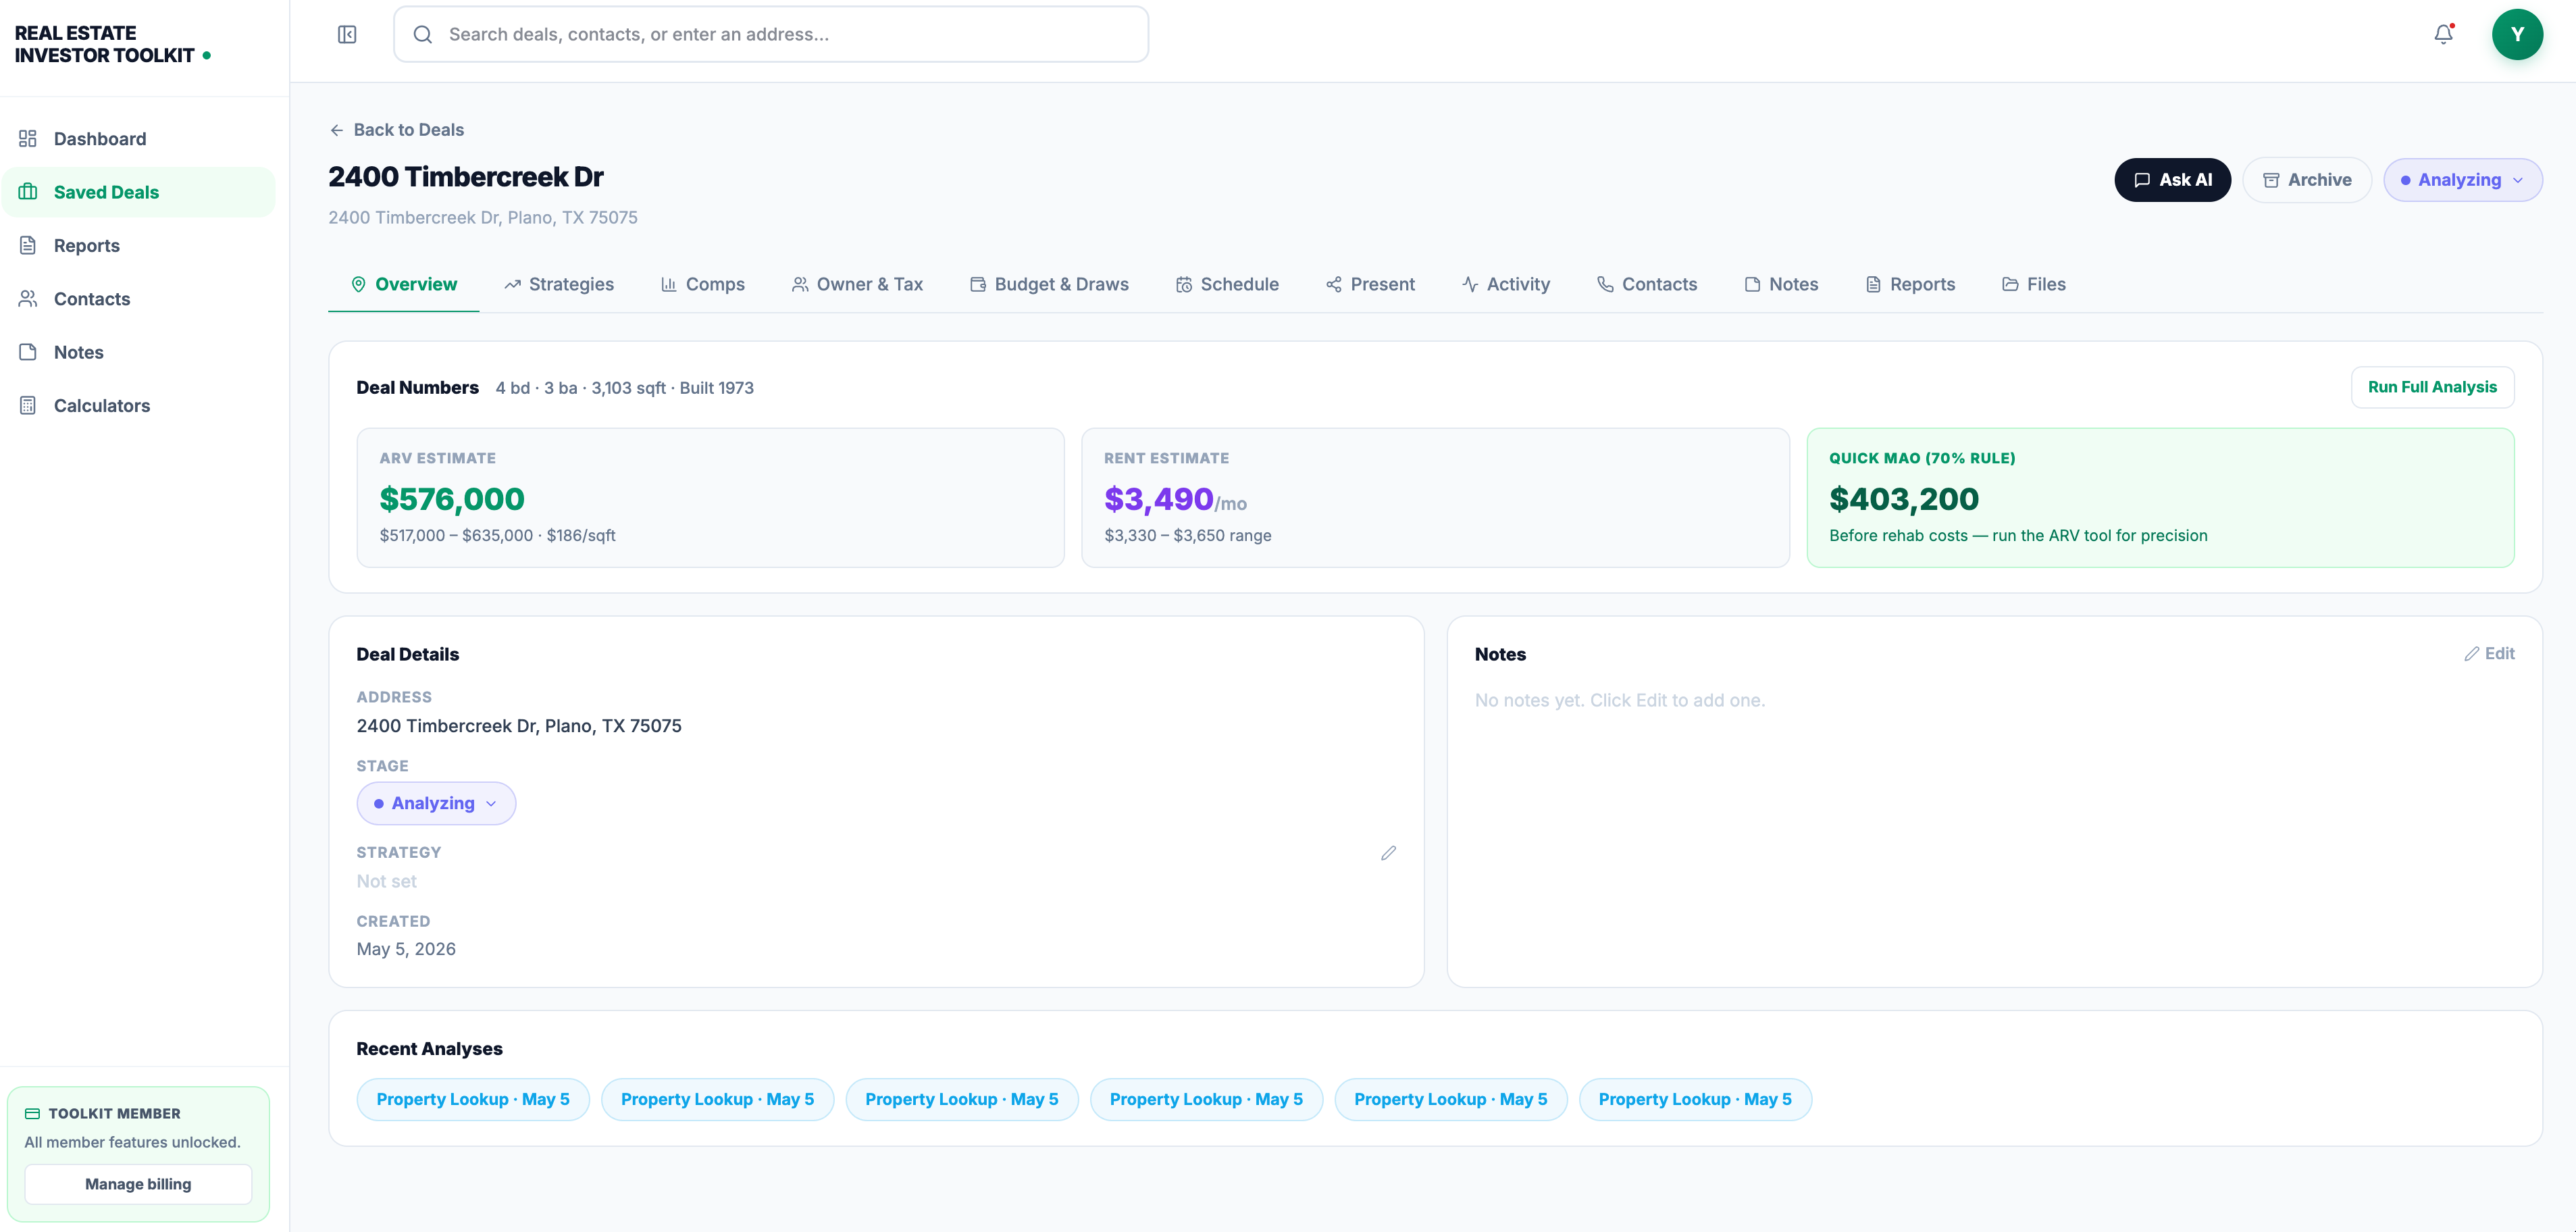
If you analyze deals regularly, the Real Estate Investor Toolkit plan is $39.99 per month and includes unlimited reports, saved deal pipelines, advanced property data, owner-occupancy details and AI chat insights. See the details on the pricing page.
FAQ
How do I calculate loss to lease?
Subtract each unit’s in-place rent from its market rent, then add up the gaps. For a percentage, divide the total gap by total market rent. For example, a $2,000 market rent and a $1,820 in-place rent give a $180 monthly gap, which is 9.0% of market rent. State which denominator you used so the figure can be compared.
Is loss to lease the same as vacancy?
No. Loss to lease applies to occupied units charging below market. Vacancy applies to units that are empty and earning nothing. Report them as separate lines in your income analysis so you can see which problem you are solving.
What is a good loss to lease percentage?
There is no single good number. A larger gap can signal rent growth potential if you can capture it at lease renewal, while a very small gap means upside depends mostly on the market. What matters is how much of the gap you can collect within your hold period after accounting for lease terms, concessions and local rules.
Can loss to lease be negative?
Yes. When a tenant pays more than current market rent, you have a gain to lease. Track it separately from below-market gaps, because netting the two can hide both renewal upside and the risk that an above-market unit resets lower when it turns over.
Should I use face rent or effective rent for market rent?
Use effective rent when comparable units offer concessions such as a free month. A $1,400 advertised rent with one month free on a 12-month lease works out to about $1,283 a month. Using effective rent keeps you from overstating the gap and the income you can collect.
Sources
- Understanding The Loss To Lease Calculation, Forbes Real Estate Council
- Entering High-growth Cities Without Overpaying, NAIOP
- Appraisal Guidance: Modeling Potential Rental Income, Freddie Mac Multifamily
- On the Road to Cash Flow, Journal of Property Management