Fix and Flip Analysis: The Numbers That Decide Buy or Pass
A rigorous fix-and-flip analysis produces five numbers: after-repair value (ARV), a bottom-up rehab budget, financing and holding costs, maximum allowable offer (MAO), and net profit with ROI. Run those numbers through a base case, then a conservative case, then a stress case, and you have a defensible answer to the only question that matters: buy, renegotiate, or walk.
Here’s what a completed analysis needs to show you at a glance:
- MAO — the ceiling price you can pay and still hit your profit target, using the 70% rule as a starting anchor
- Net profit — sale price minus every cost, in dollars
- Cash-on-cash return — your annual return relative to actual cash invested, per the standard Investopedia definition
- Break-even ARV — the resale price below which the deal loses money
Pro Tip: Never trust a single-scenario analysis. Run base, conservative, and stress versions of every deal before you make an offer. Real Estate Investor Toolkit’s ARV Calculator and Rehab Cost Calculator build these outputs automatically, without requiring an account to start.
Key Takeaways
A fix-and-flip analysis is only trustworthy when it survives a stress-tested ARV, a bottom-up rehab budget, and a realistic timeline, not just a favorable base case.
| Point | Details |
|---|---|
| MAO sets your ceiling | The 70% rule gives a starting offer cap; treat it as a filter, not a final number. |
| Bottom-up rehab beats per-square-foot | Line-item budgets catch roof, HVAC, and plumbing costs flat rates miss. |
| Comp confidence drives ARV | Apply a substantial haircut based on comp count and spread before trusting the number. |
| Stress test every deal | Add an ARV haircut, 15% rehab overrun, and 3 extra months before deciding. |
| Real Estate Investor Toolkit runs the workflow | Its ARV Calculator, Rehab Cost Calculator, and Comps Analyzer require no signup to test a deal. |
This article is general information, not a substitute for advice from a qualified financial advisor. Consult a qualified financial professional about your own circumstances before acting on anything here.
Table of Contents
- What Inputs Does a Fix and Flip Analysis Require?
- How Do You Run a Fix and Flip Analysis Step by Step?
- What Do MAO, Net Profit, and ROI Actually Tell You?
- How Do You Build a Bottom-Up Rehab Budget?
- How Do You Find Comps and Estimate ARV?
- What Mistakes Ruin Fix and Flip Underwriting?
- What Does a Worked Fix and Flip Analysis Look Like?
- Run Your Numbers Without the Spreadsheet Headache
- Sources
What Inputs Does a Fix and Flip Analysis Require?
The quality of your output depends entirely on the quality of what you feed the calculator. Garbage inputs produce a confident, wrong answer.
Every complete flip deal analysis needs these core inputs:
- Purchase price and expected closing costs
- ARV, built from a filtered set of recent comps
- Rehab budget, broken into line items rather than a flat per-square-foot guess
- Contingency, layered on top of the rehab line items
- Loan terms — points, interest rate, and draw schedule if you’re using hard money or conventional financing
- Holding costs — property taxes, insurance, utilities, HOA dues, and interest carry for the full hold period
- Acquisition and closing costs on both the buy and sell side
- Selling costs — agent commissions, staging, and marketing
A few fields are optional but worth tracking: permit timing, an alternate exit scenario, and a staging line item for higher-end resales. None of these change the math dramatically, but they sharpen your timeline assumptions.
Pro Tip: Get contractor line-item quotes whenever a project touches the roof, HVAC, electrical, or plumbing. Per-square-foot rehab guesses are the single biggest source of blown budgets on real deals, according to FundedCapital’s cost-estimation research.
Real Estate Investor Toolkit’s ARV Calculator, Rehab Cost Calculator, and Comps Analyzer map directly onto these input categories, so you’re not reinventing a spreadsheet for every deal.
How Do You Run a Fix and Flip Analysis Step by Step?
Analyzing flip deals in a calculator follows the same sequence every time, whether it’s your first house or your fiftieth:
- Enter the address and pull comps to establish a defensible ARV before you touch any cost fields.
- Enter purchase price and acquisition costs — inspection, title, escrow, and transfer fees.
- Build the rehab budget bottom-up, line by line, then add contingency on top.
- Enter financing terms — points, rate, and interest carry across the projected hold period.
- Set a realistic timeline for acquisition, rehab, and marketing/sale phases, since holding costs scale directly with time.
- Enter selling costs and your required minimum profit.
- Run three scenarios: base, conservative, and stress.
For the conservative case, haircut your ARV by a few percentage points, add contingency to rehab, and extend the hold by a month. If the deal still clears your profit threshold under stress, you have real margin. If it doesn’t, you’re relying on everything going right.
Mobile apps exist for capturing rough numbers on-site during a walkthrough, which can be useful for a first-pass gut check before you run the full analysis back at your desk.
Pro Tip: Save templates by project type. Cosmetic, gut, and systems-heavy rehabs each have a predictable cost shape, and a saved template turns a 20-minute scenario build into a 3-minute one. Keep a short notes field logging comp confidence and the date you pulled each contractor quote. Numbers go stale fast.
What Do MAO, Net Profit, and ROI Actually Tell You?
Maximum allowable offer is the ceiling price that still leaves you a profit after rehab, financing, holding, and selling costs. It compresses everything into one number: if the seller’s asking price is above your MAO, you either renegotiate or pass.
Net profit is what’s actually left after every cost hits the ledger, in dollars, not percentage. ROI measures that profit against your total investment. Cash-on-cash return narrows the lens further, measuring pre-tax cash flow against only the cash you actually put in, which matters when leverage is doing most of the heavy lifting.
Break-even ARV shows you how much room you have. A small haircut on an ARV deal can wipe out a significant amount in resale value instantly. On a deal with a $20,000 profit margin, that single haircut can flip the outcome from profitable to underwater.
- If the gap between ARV and total costs is narrow, treat that as a warning, not a green light.
- Low cash-on-cash returns despite a healthy net profit usually signal too much cash tied up relative to the leverage available.
Pro Tip: Set a personal alert threshold.
How Do You Build a Bottom-Up Rehab Budget?
Per-square-foot rehab math is fast and it is frequently wrong. It averages away the roof replacement, the panel upgrade, and the sewer line that a flat rate never sees coming. A bottom-up, line-item approach catches those costs because it forces you to price each system separately, which is why professional underwriters build budgets this way instead of applying a blanket rate.
A compact worksheet needs six fields per line item:
| Field | Purpose |
|---|---|
| Item | Roof, HVAC, electrical, plumbing, kitchen, baths, permits, site work |
| Unit | Square feet, linear feet, fixture count, or lump sum |
| Unit cost | Price per unit from a quote or local benchmark |
| Quantity | Measured or estimated amount needed |
| Labor | Separate from materials when possible |
| Total | Unit cost times quantity, plus labor |
Contingency scales with risk.
Pro Tip: Reserve contractor quotes for your highest-risk line items. Smartsheet’s construction templates offer a solid structure for tracking phases and budget lines side by side once your scope is locked.
How Do You Find Comps and Estimate ARV?
Your ARV is only as defensible as the comps behind it, and a defensible ARV is the single most contested number when you’re pitching a deal to a lender or a partner.
- Filter comps by distance — typically within a half mile in dense markets, wider in rural ones.
- Filter by sale recency — closings within the last three to six months carry the most weight.
- Filter by square footage tolerance — stay within roughly 10-15% of the subject property.
- Match renovation condition — a comp that sold in original condition isn’t comparable to your post-rehab property.
Once filtered, use the median price per square foot across the set, not the average — one outlier sale skews an average badly, while the median holds steady.
Pull data from MLS records, county assessor sites, and rental market APIs like Rentcast when you need rental context for an alternate exit, and call a local broker for market color no dataset captures.

What Mistakes Ruin Fix and Flip Underwriting?
Optimism is the most expensive input in any flip deal. Institutional-style underwriters consistently point to the same three failure points: an ARV that’s too rosy, a rehab budget built on per-square-foot shortcuts, and a timeline that ignores permitting delays. Each one compounds the others.
Run these stress tests on every deal before you commit:
- Haircut ARV below your base-case estimate
- Add 15% to the rehab budget
- Extend the hold period by three months
- Increase interest carry to match the longer timeline
- Reduce your comp set to the weakest defensible version
- Model an alternate exit — rent or refinance — in case the sale doesn’t clear
The most common mistakes stacking on top of each other: inflated ARV, flat-rate rehab guesses, undercounted carrying costs, and permitting timelines that assume everything goes smoothly.
Pro Tip: Run a pre-mortem before you offer. Write down the three most likely ways this specific deal loses money and estimate the dollar and time cost of each.
If the deal turns negative under your stress scenario, that’s your answer. Classify it as renegotiate or pass, not “it’ll probably work out.” A number that fails under reasonable stress was never actually profitable, it was just unstressed.
What Does a Worked Fix and Flip Analysis Look Like?
Here’s a deal run through the full workflow. Purchase price: $220,000. Holding costs across a five-month timeline: $9,500.
| Metric | Base case | Stress case |
|---|---|---|
| ARV | $320,000 | $304,000 |
| Rehab + contingency | $50,000 | $57,500 |
| Holding costs | $9,500 | $9,500 |
| Total costs | $304,000 | $320,000 |
| Net profit | $35,000 | $1,000 |
| ROI | 15% | 0.5% |
The base case clears a healthy margin. The stress case survives, barely, which tells you this deal has thin room but isn’t dead on arrival. That distinction, thin-but-positive versus flatly negative, is exactly what separates “renegotiate the price” from “walk away.” Export or save this comparison so a lending partner sees the same numbers you’re working from.
First-person perspective: how we approach flip underwriting
I treat every flip like it’s guilty until proven profitable. That means a confidence-weighted ARV, a bottom-up rehab budget with real contingency, and a written pre-mortem before any offer goes out. In practice, Real Estate Investor Toolkit’s ARV, Rehab, and Comps calculators are the tools I reach for first, precisely because they require no signup to start testing a deal.
Run Your Numbers Without the Spreadsheet Headache
Real Estate Investor Toolkit’s calculators turn the workflow in this article into something you can run in minutes, not a Saturday afternoon rebuilding formulas. The ARV Calculator pulls comps and applies confidence haircuts automatically, the Rehab Cost Calculator builds your line-item budget with contingency built in, and the Comps Analyzer produces the median price-per-square-foot figure your ARV depends on.
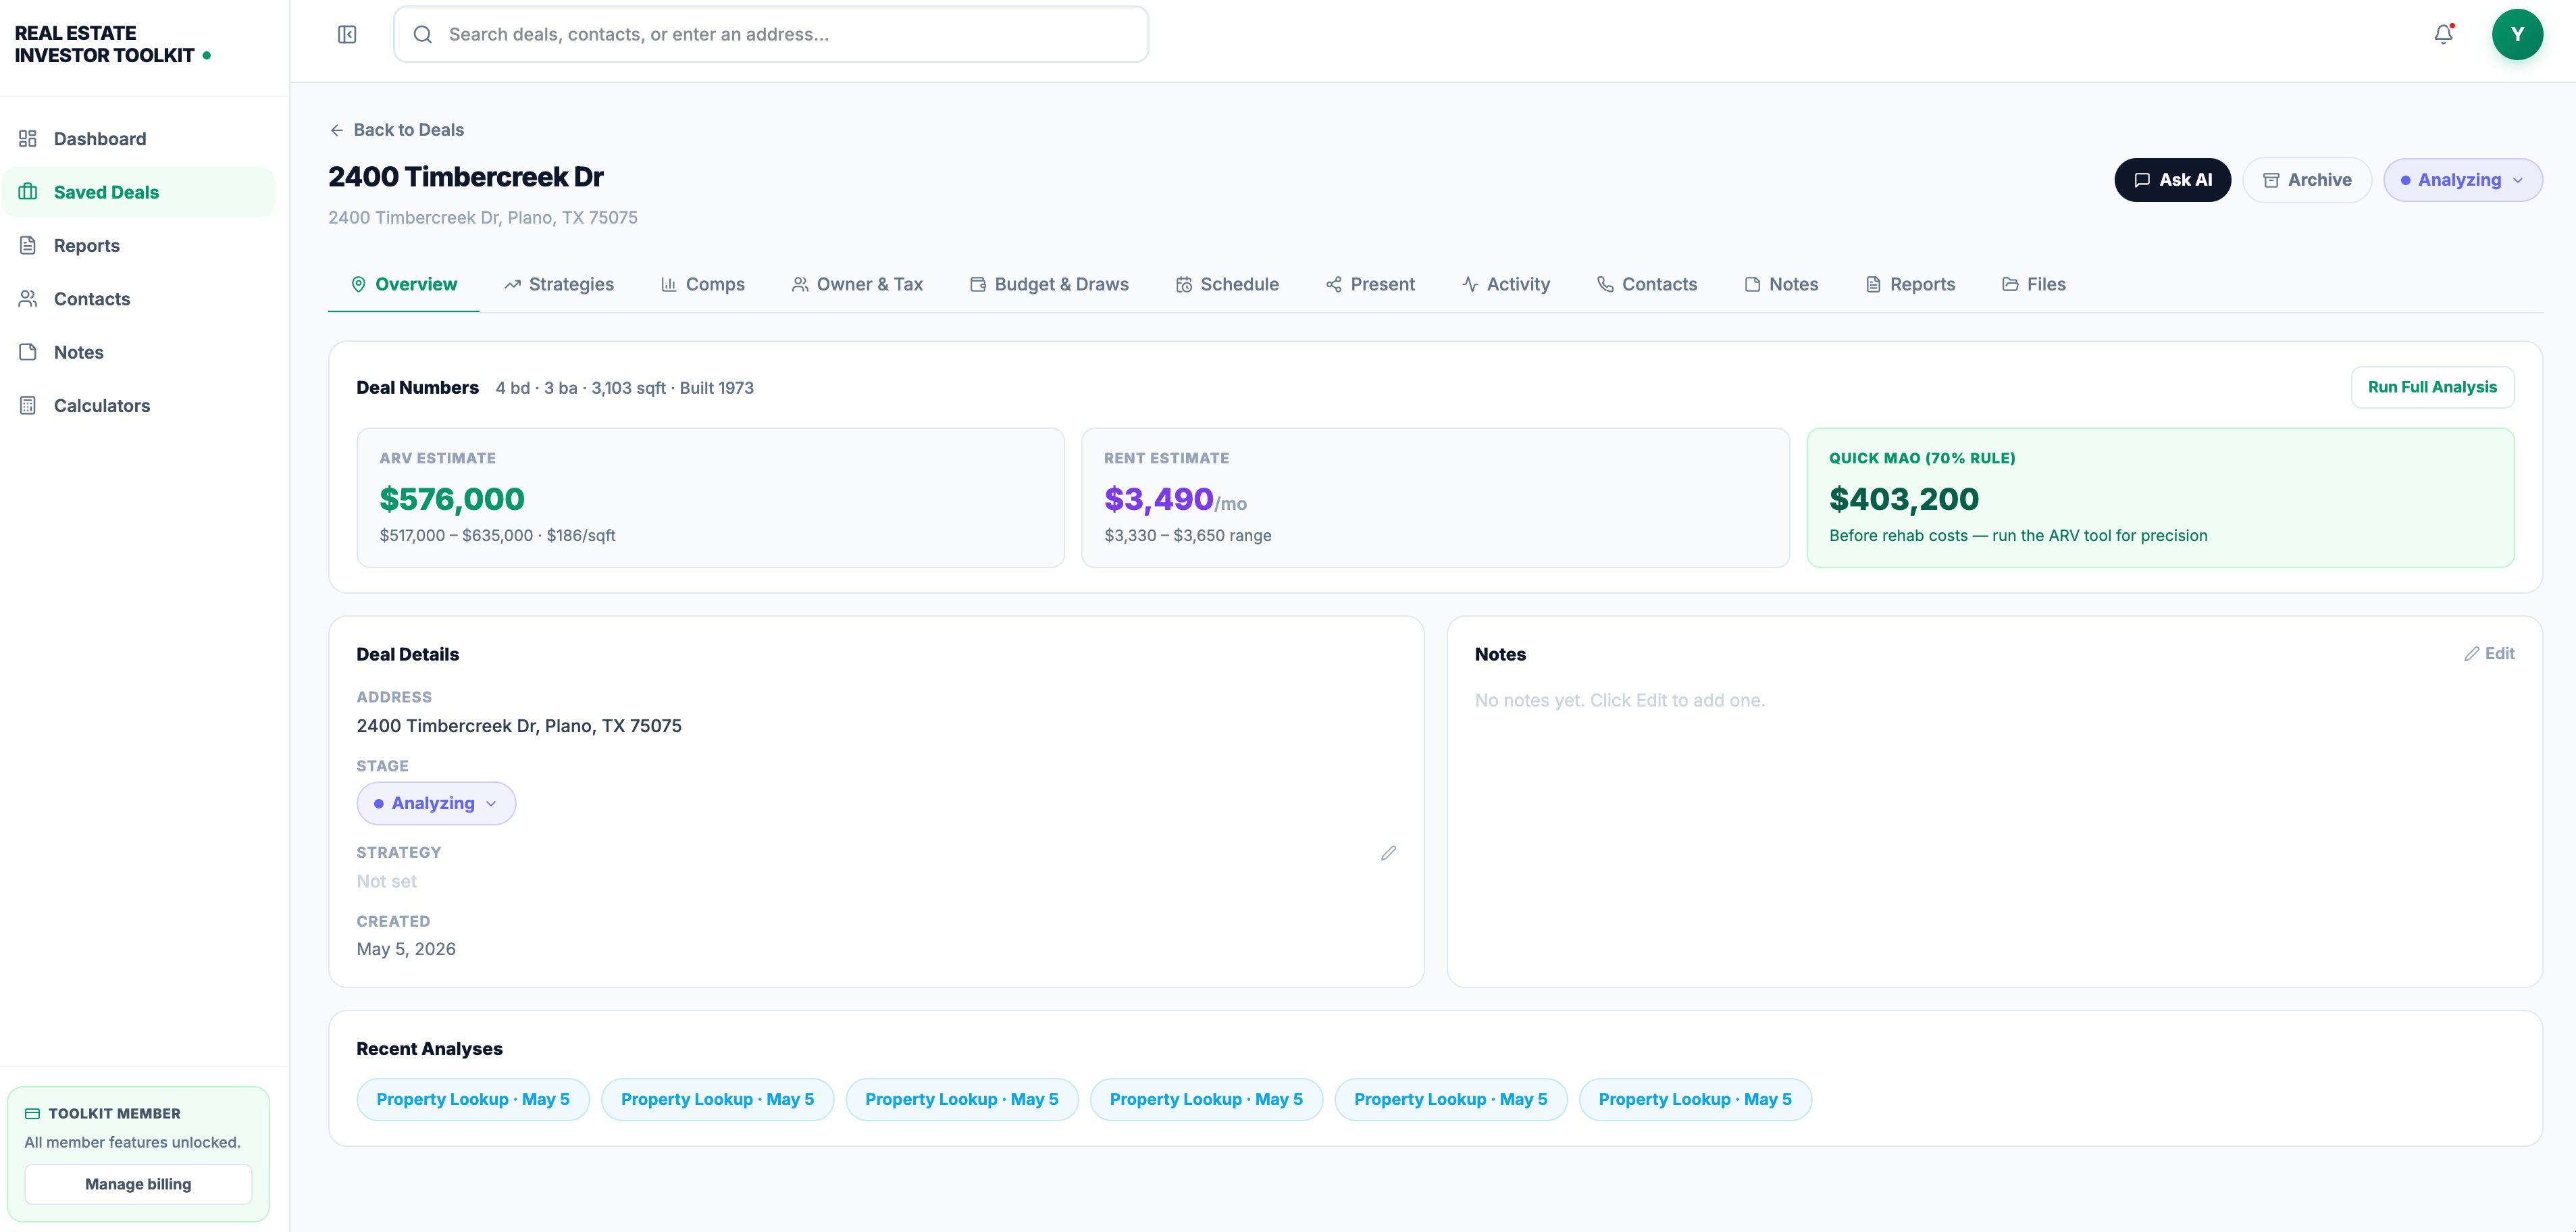
None of these tools require an account to start. Open the Rehab Cost Calculator right now, plug in the worked example above, and watch how quickly a base case turns into a stress case with three field changes. If the deal you’re evaluating might work better as a rental than a sale, the Rental Property Calculator runs that comparison side by side. Start with the free calculators and build a habit of stress-testing every offer before it leaves your inbox.
Sources
- Cash-on-Cash Return Definition | Investopedia
- Excel construction project management templates | Smartsheet
- How to estimate rehab costs (FundedCapital)
- Rentcast API
Recommended
- How to Estimate Holding Costs Before They Kill the Flip Spread — Real Estate Investing Guide | Real Estate Investor Toolkit
- How to Finance a Fix-and-Flip: Hard Money vs Conventional — Real Estate Investing Guide | Real Estate Investor Toolkit
- Real Estate Investor Toolkit — Free Investment Property Calculators
- How to Analyze a Rental Property: Cash Flow, Cap Rate, and the 1% Rule — Real Estate Investing Guide | Real Estate Investor Toolkit