Avoid a $25,500 Mistake: Zestimate vs Comps Snapshot Test for Investors

A Zestimate is a fine sanity check when you’re scanning listed homes, but it is the wrong tool for pricing an offer, screening an off-market deal, or satisfying a lender. On-market Zestimates carry a published median error of about 1.9%, while off-market estimates run closer to 7% median error. On a $500,000 property, that gap is the difference between a $9,500 miss and a $35,000 one. When the stakes are that high, local comps and a CMA or appraisal beat an algorithm every time.
TL;DR:
- Zestimates are significantly more accurate on listed properties due to list-price anchoring, with a median error of about 1.9%, but off-market estimates often err by around 7%.
- Comparing AVMs to comps shows that manual, condition-adjusted sales analysis is more reliable for offers and legal valuations, especially in heterogeneous neighborhoods.
- The median absolute percentage error for off-market Zestimates is about 17.5%, with errors increasing in mixed-use or luxury properties due to limited comparable sales.
- Timing is crucial; capturing Zestimate estimates before sales close is necessary to measure forecasting accuracy accurately, not after the fact.
- Regular local snapshot tests with tools like the Real Estate Comps Analyzer help investors understand their market-specific bias and improve deal evaluation confidence.
Table of Contents
- Comp Accuracy vs Zestimate: What Each Method Actually Measures
- Why Zestimates Vary: Data, Model, and Geography
- How to Measure Zestimate Accuracy in Your Own Market
- Checklist: What to Do When Zestimate and Comps Disagree
- How Real Estate Investor Toolkit Helps You Run These Tests
- Has Zestimate Accuracy Changed Relative to Comps Over Time?
- Zestimate vs Comps: Timeliness and Update Frequency
- Real Transactions Where Zestimate and Comps Diverged
- How to Combine Zestimate and Comps for Smarter Pricing
- A Disciplined, Test First Approach Wins
- Run the Free Market Snapshot Test With Real Estate Investor Toolkit
- Sources
- FAQ
Comp Accuracy vs Zestimate: What Each Method Actually Measures
The comp accuracy vs Zestimate question really comes down to what data each method has access to and how recently it was updated. A Zestimate is an automated valuation model, or AVM, built from public records, tax assessments, MLS feeds where available, and homeowner-submitted edits. A comparative market analysis, or CMA, is built by a human, usually an agent or investor, who hand-picks recently closed sales and adjusts them for condition, square footage, and location.
Here’s how the inputs and outputs actually stack up:
- Zestimate on-market: anchored to the active list price, refreshed frequently, median error near 1.9%.
- Zestimate off-market: no list price to anchor to, relies more heavily on public records and model inference, median error near 7%.
- CMA / comps analysis: built from 3 to 6 closed sales within a tight radius and time window, manually adjusted for condition and layout differences, no algorithmic median error published because it isn’t a mass-produced model.
- Licensed appraisal: similar comp-based process to a CMA but performed by a certified appraiser, often required by lenders, and legally defensible in a way neither an AVM nor an informal CMA is.
The reason on-market Zestimates look so much more accurate isn’t that the underlying model got smarter. It’s list-price anchoring. Once a home hits the MLS with an asking price, the model has a strong, fresh signal to lean on. Pull that anchor away, as happens with an off-market or pre-listing property, and the model has to lean on stale tax records and inferred comps instead. That’s exactly where its error roughly quadruples.
Mapping the right signal to the right moment matters more than debating which tool is “better” in the abstract:
- Quick sanity check on a listed home: Zestimate is fine.
- Screening a large batch of off-market leads: Zestimate or another AVM works for ranking, not pricing.
- Preparing an actual offer: pull tight comps or order a CMA.
- Satisfying a lender or underwriting a refinance: a licensed appraisal is required, full stop.
Academic testing backs up the ranking use case specifically. A benchmark against New York City assessment records found Zestimates preserve rank order well, with a Spearman correlation around 0.77, even while the absolute dollar figures run systematically high. In plain terms: the model is often right about which house is worth more than which other house, even when it’s wrong about the actual number.
Why Zestimates Vary: Data, Model, and Geography
Most Zestimate errors trace back to bad inputs before they trace back to bad math. Square footage mismatches are the most common culprit. Bed and bathroom counts cause the same problem when a homeowner finishes a room without filing a permit.
Tax-record lag compounds this. Counties update assessment rolls on their own schedule, sometimes annually, sometimes less often, which means a Zestimate can be pricing a home against a year-old or two-year-old snapshot of its own physical description. Homeowner edits are supposed to fix this, but self-reported updates introduce their own bias since people tend to round up on condition and square footage.
Statistic callout: The academic New York City benchmark found a median absolute percentage error near 17.5% against assessed values, with a systematic upward bias of roughly 16 to 18%, and error tails climbing past 50% in some ZIP codes at the 90th percentile.
That heavy tail is the part most people miss.
Geography and property type widen or narrow that tail dramatically. In homogeneous single-family ZIP codes with frequent turnover, the model has plenty of similar recent sales to learn from, and errors stay tighter. In mixed-use blocks, small multifamily buildings, converted duplexes, or luxury homes with unusual finishes, the pool of truly comparable sales shrinks and the model starts guessing. List-price leakage is a related model-structure issue: because on-market estimates lean so heavily on the current asking price, a home that’s deliberately overpriced or underpriced by its seller can pull the Zestimate along with it, even before a sale confirms anything.

How to Measure Zestimate Accuracy in Your Own Market
Vendor-published medians are useful for orientation, but they’re national or metro-level averages. Your ZIP code, your property type, and your price band can behave very differently, and you can find out how differently with a test you run yourself.
The single most important rule is timing: you have to capture the estimate before the sale closes. If you scrape a Zestimate off a sold listing page after the transaction records, you’re not measuring forecasting accuracy anymore. You’re measuring how fast the model absorbed the new sale price into its own output, which is a different question entirely and will make the model look far more accurate than it really was at the moment that mattered.
Here’s a workable process:
- Pick your dataset. Choose 20 to 30 properties in your target ZIP code or submarket that are either about to list or already under contract but not yet closed.
- Snapshot the estimate. Record the Zestimate (or any AVM figure) on the day you pull it, timestamped, before the closing date.
- Wait for the closing to record. Let the sale complete and the final price post to public records or MLS.
- Compute the error for each property. Calculate the percentage difference between the snapshot estimate and the final sale price.
- Aggregate three numbers, not one. Calculate the median absolute percentage error (MdAPE), the mean absolute error (MAE) in dollars, and the 90th percentile error to see your worst-case tail.
- Repeat quarterly. Local accuracy shifts as inventory and price levels move, so a test from two years ago tells you little about today.
A sample of 20 to 30 properties is a practical minimum. Fewer than that and one unusual outlier, like a distressed sale or an off-market family transfer, will swing your median. If you don’t have MLS access, you can still run this test using county recorder sale downloads paired with public tax records, just be careful to align square footage, bed and bath counts, and sale dates across both sources before you calculate anything, since mismatched inputs will corrupt your error numbers before the math even starts. A primer on pulling comps as an investor is a solid place to start if you need a refresher on comp fundamentals before building this dataset.
Pro Tip: Run your snapshot test through a comps analyzer instead of a spreadsheet. It pulls the comparable sales and adjustments automatically, so you spend your time reviewing the tail end of your error distribution instead of hand-building the dataset.
Checklist: What to Do When Zestimate and Comps Disagree
A gap between a Zestimate and your comps isn’t a reason to panic, but it is a reason to slow down and work the discrepancy systematically instead of splitting the difference.
- Verify the public record first. Confirm square footage, bed and bath counts, and lot size against the county record before trusting either number.
- Pull tight comps. Use sales from the last 3 to 6 months, within a half-mile where possible, and adjust for condition rather than accepting raw sale prices.
- Calculate the percentage gap. Compare your adjusted comp value against the Zestimate as a percentage, not just a dollar figure.
- Apply a threshold. A gap under roughly 5% is usually noise. A gap above 5 to 7% on an off-market property is a signal to order a formal CMA or appraisal before you commit.
- Convert the percentage into dollar exposure. A 7% gap on a $350,000 property is $24,500 of risk riding on which number you trust.
Statistic callout: On a home near the $500,000 median, the difference between the on-market median error (1.9%) and the off-market median error (7%) works out to roughly $9,500 versus $35,000. That’s a $25,500 swing based purely on whether the home was listed when the estimate was pulled.
Once you know your dollar exposure, translate it into deal structure. A modest gap might just mean tightening your inspection contingency or building extra room into your earnest money. A large gap, especially on a financed purchase, means preparing for an appraisal gap clause or renegotiating before you’re locked in. Reserve the licensed appraisal for anything mortgage-related, legally contested, or above your personal risk tolerance for a cash deal; a well-built CMA is usually sufficient everywhere else. An ARV calculator helps convert your adjusted comp value into a usable after-repair figure once you’ve settled on which number to trust.
How Real Estate Investor Toolkit Helps You Run These Tests
Running a proper snapshot test by hand is tedious. Real Estate Investor Toolkit’s free Real Estate Comps Analyzer pulls comparable sales and lets you adjust for condition and layout without building a spreadsheet from scratch, which is most of the manual work described above. Paired with the ARV calculator and the MAO calculator, you can move from a raw comps pull to an after-repair value and a maximum allowable offer in the same workflow, rather than juggling three separate tools.
To reproduce the MdAPE and tail statistics covered earlier, run the comps analyzer against your snapshot dataset, export the adjusted values, and calculate the percentage error against final sale prices once they close. The tool handles the comp selection and adjustment math; you still need to timestamp your snapshots yourself if you want a clean, forecasting-accurate test rather than a hindsight one.
Has Zestimate Accuracy Changed Relative to Comps Over Time?
Zillow has narrowed its published on-market error over the years as it’s absorbed more MLS data and refined its model, but the fundamental gap between on-market and off-market performance hasn’t closed. The 1.9% on-market versus 7% off-market split still holds as the general pattern investors should expect. Comps-based valuation, meanwhile, hasn’t changed in accuracy because it isn’t a model that improves with more training data. It’s a manual process anchored to whatever sales actually closed nearby.
What has shifted is how much data feeds each side. MLS coverage has grown, public records have digitized further, and both trends should, in theory, help AVMs. But the academic benchmark against New York City assessments still found heavy-tailed errors clustering geographically, meaning more data hasn’t erased the structural weakness in heterogeneous neighborhoods. The gap between a tidy suburban subdivision and a mixed-use urban block persists regardless of how much the underlying dataset has grown.
For investors, the practical takeaway hasn’t moved either. AVMs are a screening tool whose relative accuracy trend is improving slowly, at the margins, while comps remain the pricing tool whose accuracy depends entirely on how carefully you select and adjust the sales you pull. Neither has leapfrogged the other; they still serve different jobs.
Zestimate vs Comps: Timeliness and Update Frequency
A Zestimate updates automatically, often multiple times a week, as new public records, tax assessments, and nearby sales feed into the model. That speed is genuinely useful for tracking a market at a glance, but it’s also part of why off-market estimates drift: frequent updates on stale or incomplete data don’t make the number more accurate, just more current-looking.
Comps and a CMA update only when someone builds them. That’s a real disadvantage for speed. An agent or investor pulling comps today is working from whatever sales have actually closed and recorded, which can lag the true market by 30 to 60 days depending on how quickly a county processes recordings. You won’t get a fresh CMA refreshed automatically overnight.
The practical fix is to treat the two as complementary rather than competing on speed. Use the Zestimate’s constant refresh to monitor a watchlist of properties or a target ZIP code for movement, then pull fresh comps only when you’re seriously evaluating a specific deal. Trying to keep a hand-built CMA current on every property in your pipeline wastes time; trying to price an actual offer off a number that updates itself weekly without your review is how investors get burned. Speed and accuracy aren’t the same axis, and conflating them is the most common mistake in this comparison.
Real Transactions Where Zestimate and Comps Diverged
The clearest discrepancies show up in exactly the conditions the data predicts: off-market properties, unusual layouts, and neighborhoods with thin recent sales activity. A small multifamily property in a transitional block, for example, often carries a Zestimate built on a handful of dissimilar comps because true 2 to 4 unit comparables are scarce.
Luxury and unique properties tell a similar story. A home with a custom addition, an unpermitted renovation, or a highly specific lot condition (a steep grade, a flood zone, a shared driveway) confuses an AVM because the model has no clean way to weigh a feature it rarely sees. A comps-based approach that manually adjusts for that specific feature will consistently outperform an automated estimate in these cases, sometimes by tens of thousands of dollars on a single property.
Even within ordinary single-family homes, timing creates divergence. A property that just had a Zestimate refresh based on a neighbor’s below-market distressed sale can temporarily show a value well under what tight, condition-adjusted comps would support. Investors who don’t cross-check against actual closed comps risk either overpaying based on inflated confidence or, just as often, walking away from a legitimately good deal because the AVM understated it.
How to Combine Zestimate and Comps for Smarter Pricing
The most efficient workflow treats the Zestimate as a first filter and comps as the final word. Use an AVM to screen a large batch of leads quickly, ranking them by relative value, then reserve the slower, more careful comps work for the properties that actually clear your first screen. This matches how the rank correlation properties of AVMs actually behave: strong at ordering, weaker at precision.

Once a property survives the initial screen, don’t average the Zestimate and your comp value together. That approach, tempting as it seems, just blends a rough estimate with a precise one and drags your precise number toward the rough one’s bias. Instead, treat your adjusted comp value as the anchor and use the Zestimate only as a check for whether you’ve missed something (an unusual assessment, a data error, a public record discrepancy worth investigating further).
Document both numbers and the reasoning behind any gap before you finalize an offer. If a lender or partner later questions your pricing, having a clear record of your comps, your adjustments, and why you discounted the AVM figure will matter more than the AVM number itself ever would.
A Disciplined, Test First Approach Wins
Most investors treat AVM accuracy as a settled debate: comps win, Zestimates are unreliable, end of discussion. That’s lazy. The more useful framing is that Zestimates are efficient screening tools with a known, measurable bias, and the discipline is in measuring that bias locally rather than trusting a national average. Screen with an AVM, verify with comps, and reserve appraisals for anything with real financial or legal weight riding on the number. Investors who run their own quarterly snapshot test consistently make faster, more confident offers than those relying on gut instinct about which tool “feels” more accurate.
— Michael
Run the Free Market Snapshot Test With Real Estate Investor Toolkit
You don’t need a data science background to find out how far off Zestimates run in your own ZIP code, you just need the right tools and a little discipline about timing your snapshots. Real Estate Investor Toolkit’s free calculators require no sign-up, so you can pull comps, run an ARV, and check your MAO math the moment you spot a property worth screening, without creating an account just to see if a deal pencils out.
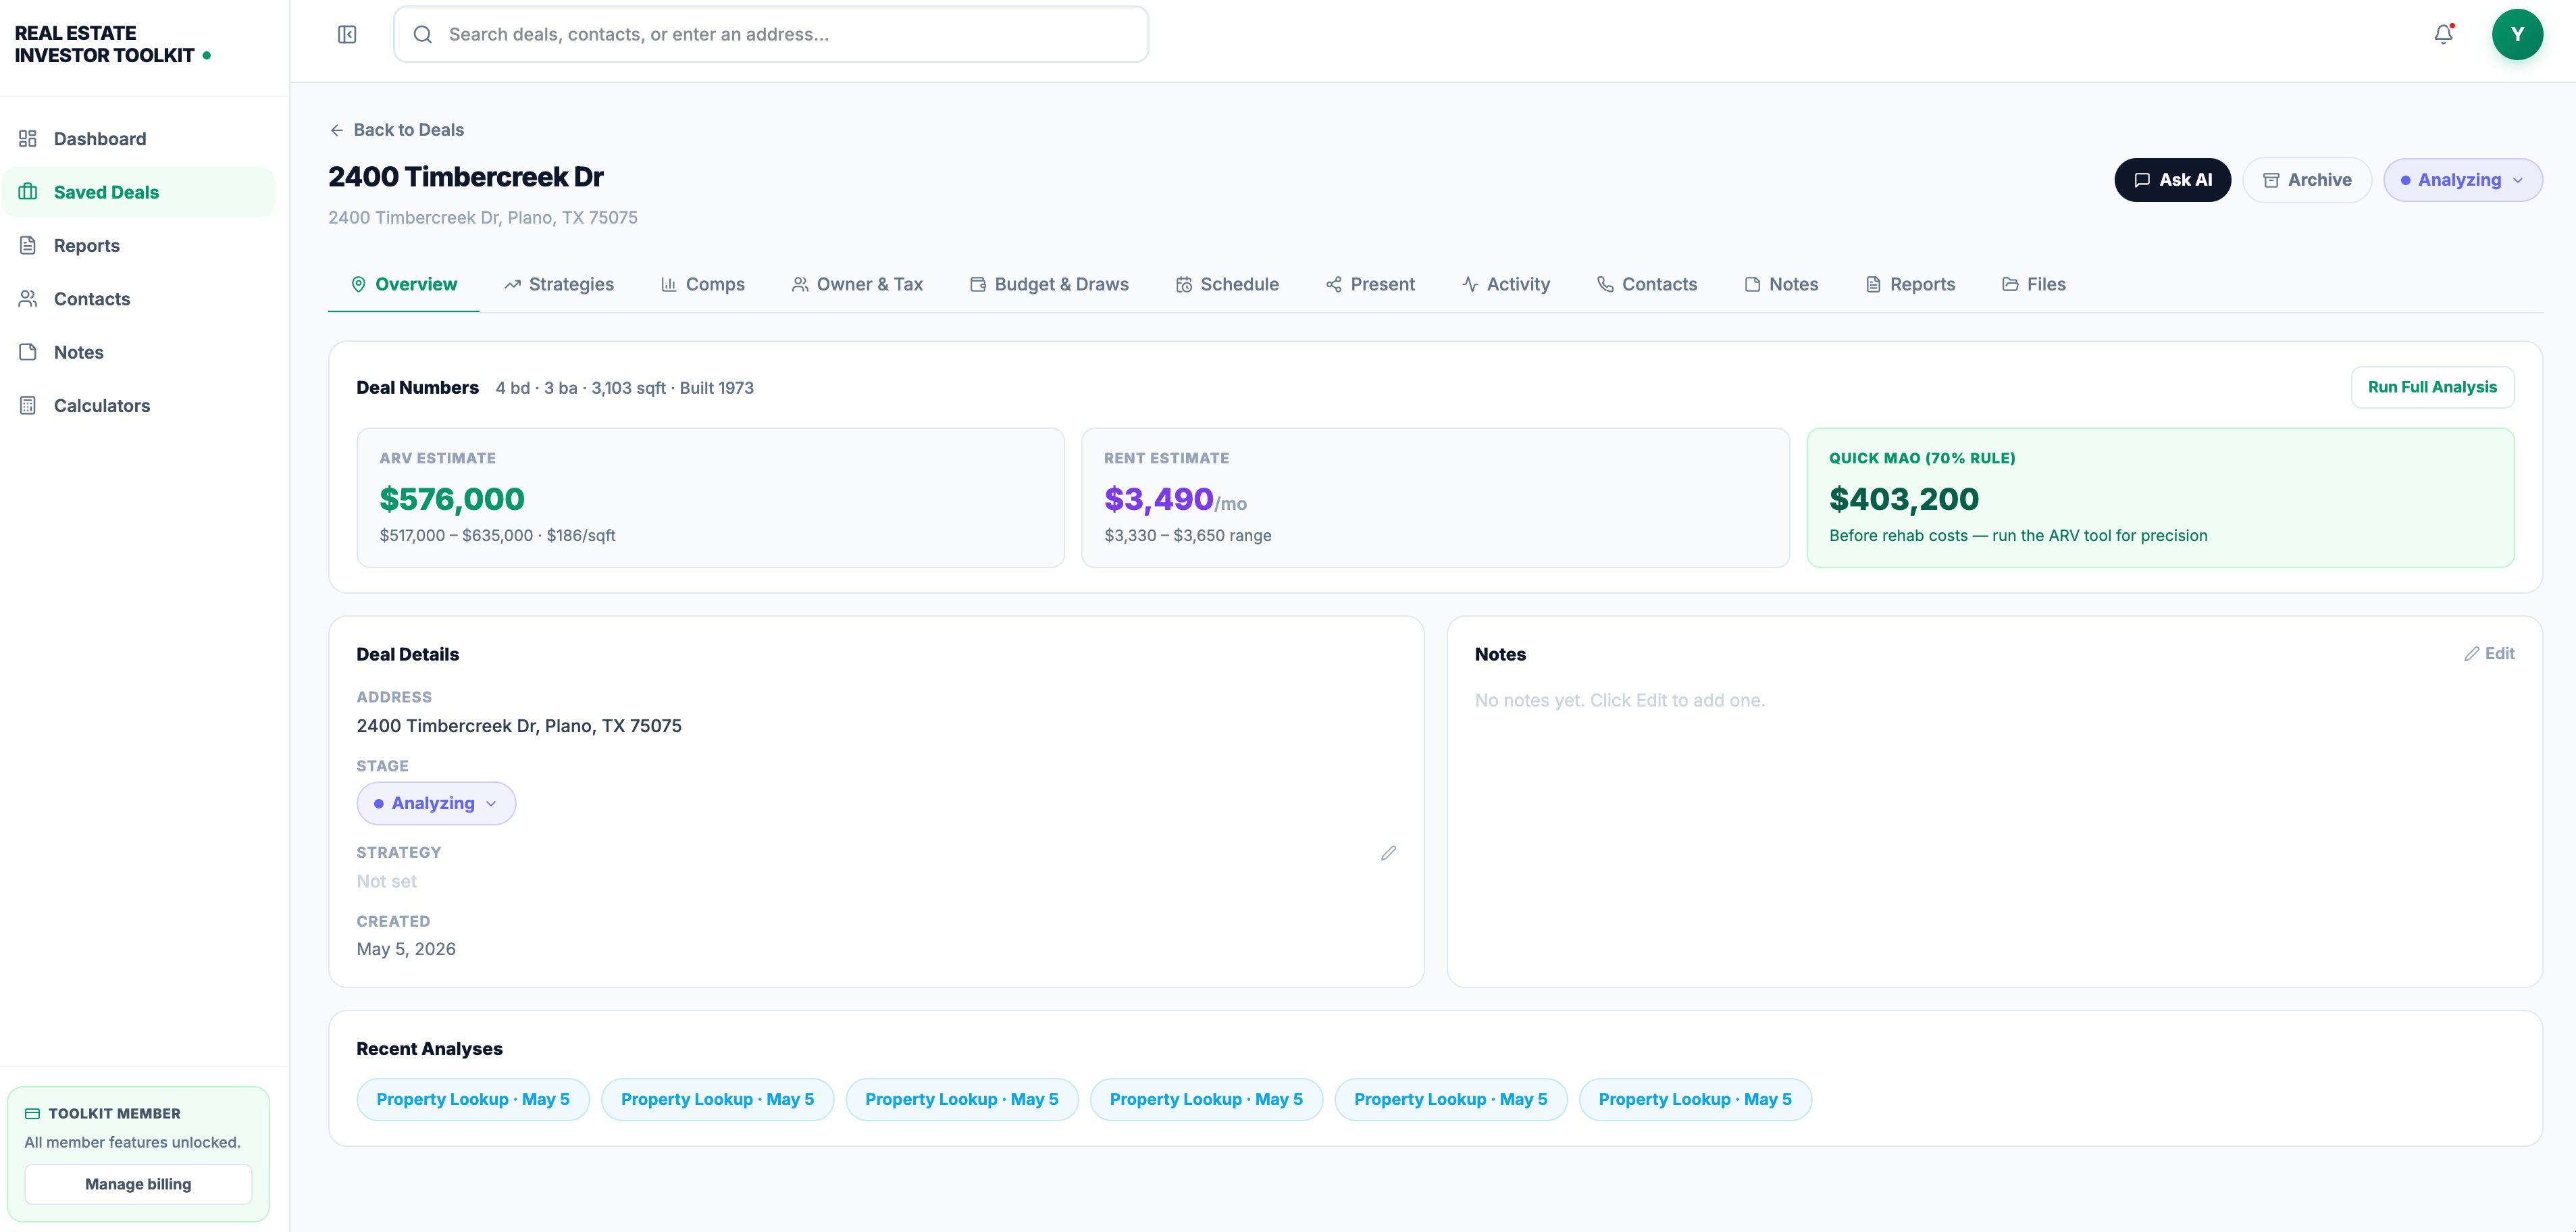
Start with the Real Estate Comps Analyzer to build your snapshot dataset and calculate adjusted comp values against whatever AVM number you’re checking. Pair it with the ARV calculator to convert that comp value into an after-repair figure, and the MAO calculator to see what offer actually makes sense once repair costs and your margin are accounted for. If you’re running enough deals that you need saved pipelines, unlimited property reports, or owner and absentee-owner data on tap, the paid plan runs $39.99 a month and unlocks all of it in one place instead of stitching together separate subscriptions. Try the free tools first. Upgrade only when your deal volume actually demands it.
Sources
- Zestimate vs. Reality: Benchmarking Automated Valuations against New York City Assessments | Advances in Consumer Research
- Zestimate vs Redfin Estimate: Which Home Value Is More Accurate? | The Mine Works
- Ibuyer
FAQ
What is more accurate than a Zestimate?
A licensed appraisal or a well-built CMA using tight, condition-adjusted comps is generally more reliable than a Zestimate, especially for off-market or unique properties. Running a local snapshot test with a tool like the Real Estate Comps Analyzer lets you measure exactly how much more accurate comps are in your specific market.
Are Zestimates usually low or high?
Zestimates tend to run high rather than low. The academic New York City benchmark found a systematic upward bias of roughly 16 to 18% against assessed values, so treat a Zestimate as a likely ceiling rather than a neutral midpoint.
Who has the most accurate home estimates?
No single AVM is uniformly most accurate everywhere; accuracy depends heavily on whether a home is listed and how homogeneous the neighborhood is. On-market estimates from major vendors land close to 1.9 to 1.85% median error, but the only way to know which source performs best in your specific ZIP code is to run your own snapshot test against actual closed sales.