Cash-on-Cash Return: 5 Steps to Verify a 10% Yield

Cash-on-cash return equals annual pre-tax cash flow divided by total cash invested. It’s the quick math you run to see how hard your actual dollars are working, stripped of appreciation, tax effects, and mortgage paydown. Most cash-flow investors treat it as the first filter on a deal, not the final word.
TL;DR:
- Vacancy assumptions, interest rates, and down payment size heavily influence the cash-on-cash return, with changing these factors significantly altering the percentage.
- A cash-on-cash return above 20% is often a leverage artifact rather than an indicator of quality, especially with high debt levels.
- It best measures early-year returns and can be skewed by one-time events like refinancing or large concessions, which should be tested separately.
- The typical good range for cash-on-cash return varies from 6% to 12%, depending on the property type and investment strategy, with lower returns common in buy-and-hold rentals.
- Simplified calculators help compare different scenarios quickly, highlighting how leverage, vacancy, and expenses impact the actual cash yield before making investment decisions.
Table of Contents
- What Cash-on-Cash Return Actually Measures
- How to Calculate Cash on Cash Return, Step by Step
- What Is a Good Cash-on-Cash Return?
- What Cash-on-Cash Return Doesn’t Tell You
- How Financing Changes Your Cash-on-Cash Return
- Checklist: Verify These Inputs Before You Trust a CoC Number
- Where Cash-on-Cash Return Fits in a Real Screening Process
- Run Your Own Numbers With Real Estate Investor Toolkit
- Sources
What Cash-on-Cash Return Actually Measures
Cash-on-cash return is annual pre-tax cash flow divided by total cash invested, shown as a percentage. Put a property that nets $6,000 a year against $60,000 out of pocket and you get 10%.
The numerator, annual pre-tax cash flow, is your net operating income minus annual debt service. That’s rental income after vacancy and operating expenses, minus whatever you pay the lender that year in principal and interest combined.
The denominator, total cash invested, is every dollar you put in to close and stabilize the deal: down payment, closing costs, initial repairs, and any reserves you funded up front. Skip the reserves and you’ll flatter your own numbers.
There’s a real difference between pre-tax and after-tax versions. The formula above is pre-tax by default. Getting to an after-tax figure requires your own tax bracket and depreciation, which is why most investors run pre-tax first and adjust later in due diligence.
How to Calculate Cash on Cash Return, Step by Step
Getting from gross rent to a final percentage takes five steps, and the order matters because each one strips out a layer of noise.
- Start with gross scheduled rent. This is what the unit would collect at full occupancy, market rate.
- Subtract a vacancy allowance. Use actual historical vacancy for an occupied property, or a conservative market estimate for one you’re underwriting.
- Subtract operating expenses. Taxes, insurance, management, maintenance, and reserves. What’s left is net operating income (NOI).
- Subtract annual debt service. Principal and interest payments for the year. What’s left is annual pre-tax cash flow.
- Divide by total cash invested, then multiply by 100.
Here’s the cash-on-cash return formula applied to a real number set:
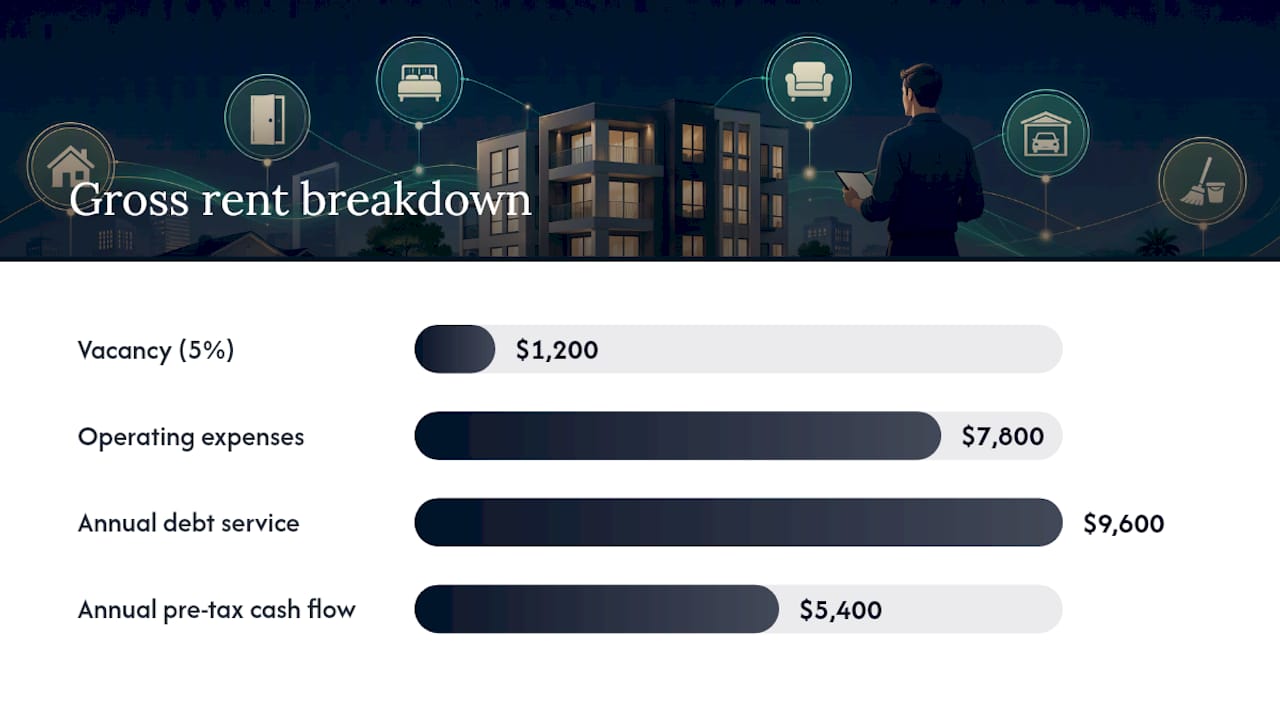
- Gross scheduled rent: $24,000
- Vacancy (5%): minus $1,200
- Operating expenses: minus $7,800
- NOI: $15,000
- Annual debt service: minus $9,600
- Annual pre-tax cash flow: $5,400
- Total cash invested (down payment, closing costs, repairs): $54,000
- Cash-on-cash return: $5,400 ÷ $54,000 = 10%
A 10% cash-on-cash return means every dollar you invested returned 10 cents in spendable cash that year, before taxes. That’s a clean, comparable number, but it only holds if the inputs behind it are honest.
Three levers move that 10% more than anything else: vacancy assumptions, the interest rate on your loan, and how big a down payment you make. Running that math by hand for every deal gets old fast, which is where a rental property calculator earns its keep. Punch in three or four vacancy and rate scenarios and you’ll see which variable actually breaks the deal.
What Is a Good Cash-on-Cash Return?
There’s no single number that qualifies as good, but investors commonly reference a 6% to 12% range as a rough guide, and where your deal lands inside that band depends heavily on strategy and market.
- Buy-and-hold long-term rentals in stable, lower-cost markets often settle in the 6% to 9% range, with more of the total return expected from appreciation and equity paydown over time.
- Short-term rentals can post higher headline numbers, sometimes north of 12%, because nightly rates outpace long-term lease income, but they also carry higher expense volatility and vacancy risk.
- Commercial and value-add deals vary widely depending on the business plan, lease structure, and how much of the return is expected to come from a future sale.
Treat an unusually high cash-on-cash return with suspicion before celebration. A number pushed above 15% or 20% is frequently a leverage artifact, not a sign of a great deal. The more debt you layer onto a property, the more the percentage inflates, and the more fragile that cash flow becomes if rates rise or a unit sits vacant.
What Cash-on-Cash Return Doesn’t Tell You
Cash-on-cash return is a snapshot, and snapshots miss the picture that unfolds over the next five or ten years of ownership.
- It ignores appreciation entirely, along with any gain you’d realize on sale or refinance.
- It doesn’t credit principal paydown. Your full mortgage payment counts as an expense even though part of it is building your equity, not just servicing debt.
- It says nothing about the time value of money, so it can’t tell you whether a 10% return this year beats a 10% return five years from now.
- It’s pre-tax, and depreciation can swing your after-tax position significantly depending on your bracket, something worth understanding through resources on how rental income reporting works for landlords.
- One-time events distort it. A refinance that pulls out cash, or a distribution that’s actually return of capital rather than operating income, can make a single year’s CoC look far better than the property’s real earning power.
Common input mistakes compound these blind spots: using pro forma rent instead of actual trailing income, forgetting one-time repair costs in the cash-invested figure, or averaging a strong month into an annual number.
Pro Tip: If a deal’s cash-on-cash return looks great mainly because of a large cash-out refinance or a one-time concession, run the number again excluding that event. What’s left is the property’s real recurring yield.
Because of these gaps, cash-on-cash return works best as a first-year or early-hold metric. Once you’re weighing a multi-year hold with a planned sale or refinance, IRR gives a fuller lifecycle picture that accounts for the timing of every dollar in and out.
How Financing Changes Your Cash-on-Cash Return
Debt is the single biggest lever on cash-on-cash return, and running the same property two ways makes that obvious.
- All-cash purchase: Buy a $200,000 property outright. NOI of $15,000 with no debt service means your cash flow is $15,000, and your cash invested is the full $200,000 plus closing costs. Cash-on-cash return: roughly 7%.
- Financed purchase, 20% down: Put $40,000 down plus closing costs, finance the rest. NOI stays at $15,000, but now you subtract debt service, say $9,600 a year. Pre-tax cash flow drops to $5,400, against $54,000 invested. Cash-on-cash return: 10%.
- Financed purchase, 10% down: Less cash in, but a bigger loan means higher annual debt service, which eats further into cash flow even though your invested capital shrank. The percentage can climb higher still, but the cushion against a vacancy or a rate reset gets thinner.
A financing calculator makes this comparison fast, since amortization schedules and interest rate changes ripple through debt service in ways that are tedious to recalculate by hand.
The pattern holds generally: smaller down payments and lower rates push cash-on-cash return up, because you’re dividing a similar cash flow by a smaller invested base. But a higher percentage from heavier leverage isn’t automatically a better outcome. It comes with thinner margins, more interest paid over the loan’s life, and less equity cushion if the market softens.
Checklist: Verify These Inputs Before You Trust a CoC Number
Before you act on any cash-on-cash figure, run it against a short gut check.
- Confirm you’re using actual trailing income where it exists, not the listing agent’s “potential” rent.
- Apply a conservative vacancy rate, not a best-case scenario, especially in a market you don’t know well.
- Separate recurring operating expenses from one-time costs like a new roof or an initial rehab, so neither category leaks into the wrong side of the equation.
- Check whether any cash distribution you’re counting is genuine operating income or return of capital from a refinance or sale.
- Stress-test the number: what happens to CoC if rent falls 10%, expenses rise 25%, or your rate resets two points higher?
- Write down every assumption you used, so you can revisit and correct it once you have real operating data.
Pro Tip: Calculate cash-on-cash return twice, once with the seller’s numbers and once with your own conservative estimates. The gap between the two tells you how much cushion, or how much risk, is baked into the asking price.
Where Cash-on-Cash Return Fits in a Real Screening Process

Cash-on-cash return is the first filter, not the final answer. Before modeling ten years of appreciation, equity paydown, and exit scenarios, it’s worth confirming a property clears a basic cash-flow bar today.
In practice, that means running CoC on every deal that crosses your desk, discarding anything that doesn’t hit your minimum threshold, and only then building out IRR and pro forma projections for the survivors. Repeating that screen manually gets tiresome, which is the real value calculators bring: consistent inputs, fast iteration, and the ability to test five financing structures in the time it used to take to build one spreadsheet.
— Michael
Run Your Own Numbers With Real Estate Investor Toolkit
Real Estate Investor Toolkit turns the math in this article into a two-minute check instead of a spreadsheet project. The rental property calculator computes cash-on-cash return, cap rate, and monthly cash flow side by side, so you see immediately how a change in rent or expenses moves your bottom line.
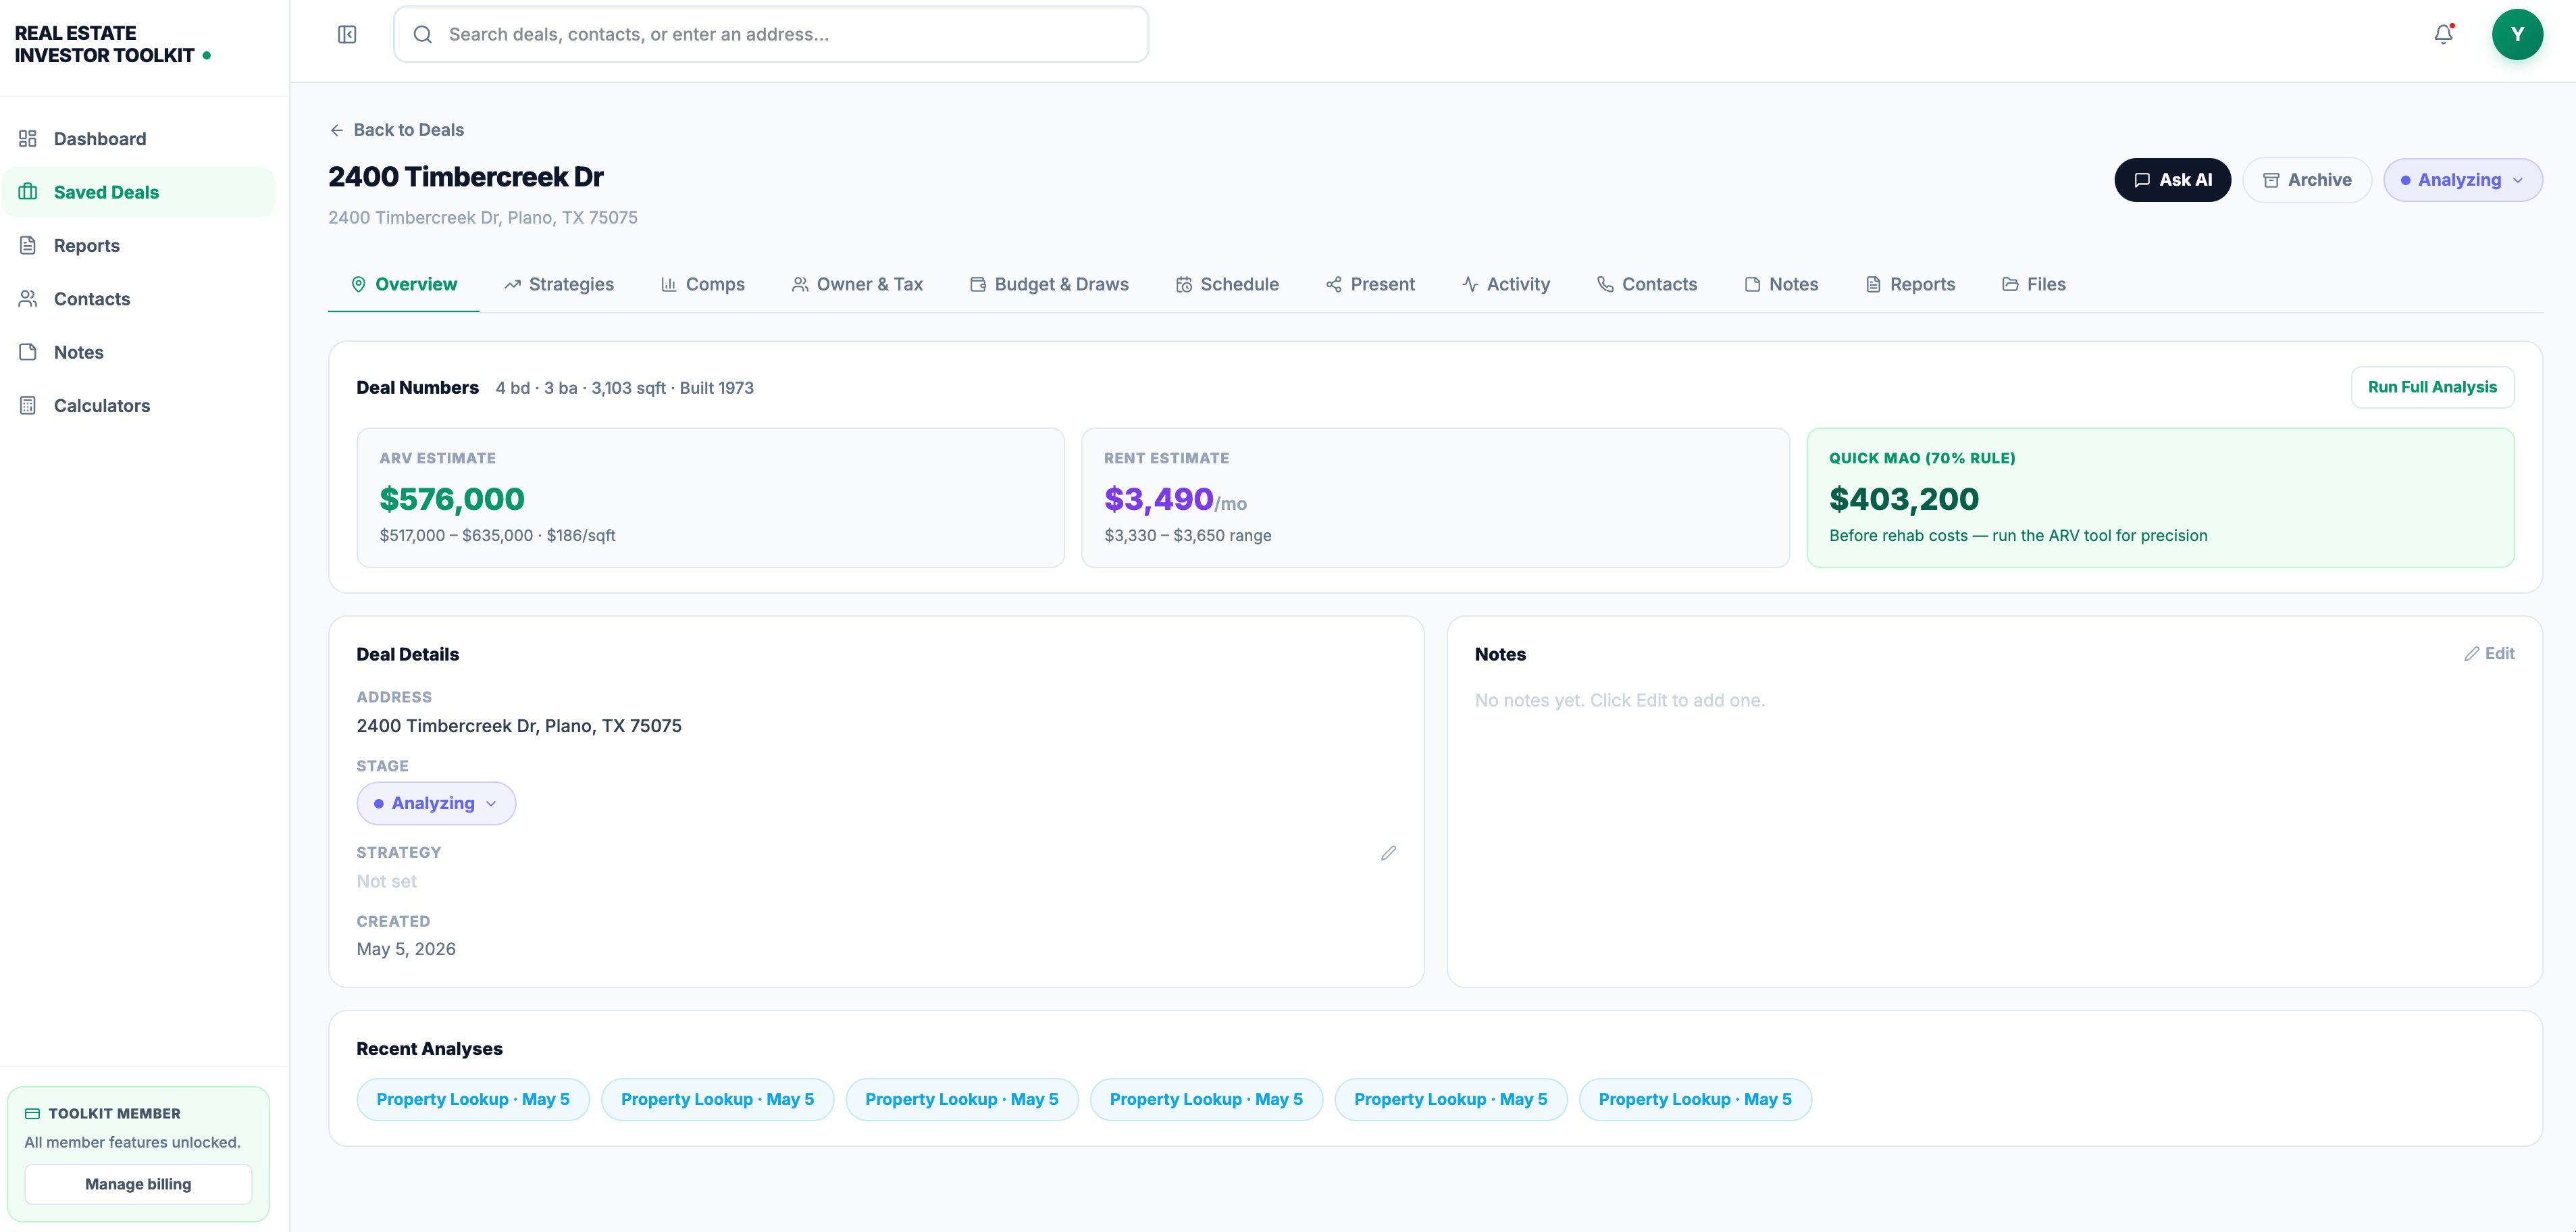
Users can run a quick check on a single property without creating an account, which matters when screening several listings back to back. Pair it with the financing calculator to test different down payment and rate combinations on the same property, and you’ll see exactly how leverage is shifting your return before you make an offer. Start with the rental calculator on your next deal and compare the seller’s numbers against your own conservative estimates.
Sources
- Cash-on-Cash Return (COCR) in Real Estate | JPMorgan Insights
- Cash-on-Cash Return: Real Estate Investment Guide & Formula | Investopedia
- Cash on cash return — Wikipedia