3 Scenarios That Show When Cash Flow Beats Appreciation for Investors

Cash flow is your safety net; appreciation is your wealth engine. If you need income now, have limited reserves, or can’t ride out a downturn, underwrite for cash flow. If you have a long hold horizon, strong reserves, and a defensible thesis about a specific market, appreciation can carry more weight. Most disciplined investors end up blending both.
TL;DR:
- Most investors should blend cash flow and appreciation strategies based on their income needs, reserves, and market conditions rather than choosing one exclusively.
- Underwriting for cash flow requires conservative estimates of rent, vacancy, expenses, and debt, with lenders typically expecting a debt service coverage ratio of at least 1.20 to 1.25.
- Appreciation forecasting depends on market fundamentals like population growth, job diversification, and supply constraints, but it involves significant uncertainty and should be treated as upside potential.
- Leverage amplifies both gains and losses, with rising interest rates making cash-flow deals harder to sustain and potentially pushing investors toward appreciation bets.
- A balanced portfolio assigns properties specific roles for income or growth and uses tools like rental calculators and rehab models to ensure numbers support investment decisions.
Table of Contents
- Cash Flow vs Appreciation: The Core Differences
- How to Measure and Underwrite Cash Flow
- How to Evaluate Appreciation Potential
- Risk, Timing, and Predictability: What Actually Breaks a Plan
- A Decision Framework for Picking the Right Strategy
- Three Worked Scenarios That Show How the Math Actually Moves
- Building a Portfolio That Uses Both
- Tools to Test Your Own Numbers Before You Buy
- Practical Rules I Use When Choosing Between Cash Flow and Appreciation
- Run Your Own Numbers With Real Estate Investor Toolkit
- Sources
Cash Flow vs Appreciation: The Core Differences
Cash flow is the net income left over after a property’s operating expenses, mortgage payment, taxes, insurance, and management fees are paid. It shows up in your bank account monthly, whether the property’s value moves or not. Appreciation is growth in market value, and you don’t actually pocket it until you sell or refinance.
That timing gap is the whole story. Cash flow rewards you every month, in cash, regardless of what the broader market is doing. Appreciation rewards you eventually, in equity, and only if the market cooperates. Cash flow is measurable and observable today; appreciation is a forecast, and forecasts are frequently wrong.
Here’s the quick breakdown:
- Cash flow pays out monthly, is driven by rent and expense control, and its main risks are vacancy, repairs, and rising rates.
- Appreciation pays out at sale or refinance, is driven by market fundamentals and scarcity, and its main risks are timing, illiquidity, and cyclical downturns.
- Cash flow tends to outperform in landlord-favorable, lower-cost markets with strong rent-to-price ratios.
- Appreciation tends to outperform in supply-constrained metros with strong job and population growth, even when current rents look thin.
Neither approach is inherently better. They solve different problems, and the mistake most new investors make is picking one without asking which problem they’re actually trying to solve.
How to Measure and Underwrite Cash Flow
Cash flow underwriting starts with a formula, not a feeling: Gross Rent minus Vacancy Allowance minus Operating Expenses minus PITI (Principal, Interest, Taxes, Insurance) equals Net Cash Flow. Every input needs to be conservative, because optimistic assumptions are how deals that look great on a spreadsheet lose money in real life.
Work through it in this order:
- Pull gross rent from verified comps, not from a landlord’s wish list or a listing description.
- Apply a vacancy allowance, typically 5% to 8% of gross rent depending on the market and tenant class.
- Add operating expenses (OPEX): repairs, maintenance, property management (typically 8% to 10% of rent), landscaping, and a capital reserve fund for big-ticket replacements.
- Layer in PITI, your full monthly debt and insurance obligation.
- Calculate Net Operating Income (NOI) by subtracting vacancy and OPEX from gross rent, before debt service.
- Divide annual cash flow by your total cash invested to get cash-on-cash return, and calculate your Debt Service Coverage Ratio (DSCR) by dividing NOI by annual debt payments.
Most lenders want to see a DSCR of at least 1.20 to 1.25 before they’ll approve financing on an investment property, and some non-bank lenders will go as low as 1.0 with a rate premium attached, according to underwriting guidance from Emory Lending. Skipping vacancy allowances or underestimating maintenance costs are the two most common ways investors talk themselves into a bad deal.
Pro Tip: Run your numbers through a rental property calculator before you make an offer, not after. Seeing cash-on-cash return and DSCR side by side takes the guesswork out of whether a deal actually pencils.
How to Evaluate Appreciation Potential
Appreciation is harder to underwrite because you’re forecasting, not calculating. It should always be treated as a secondary benefit, not the reason a deal makes sense, since reliable appreciation forecasting is genuinely difficult even for experienced analysts.
Start with market fundamentals:
- Population growth and net migration trends over the last three to five years.
- Job growth, especially diversification across employers and industries rather than reliance on one.
- Supply constraints: zoning restrictions, permitting timelines, and available buildable land.
- Permitting trends that signal whether new competing inventory is coming online fast.
Then check property-level indicators: the trend line in comparable sales over the past 12 to 24 months, price-per-square-foot growth relative to the metro average, and any renovation upside that lets you force appreciation rather than wait for the market to deliver it.
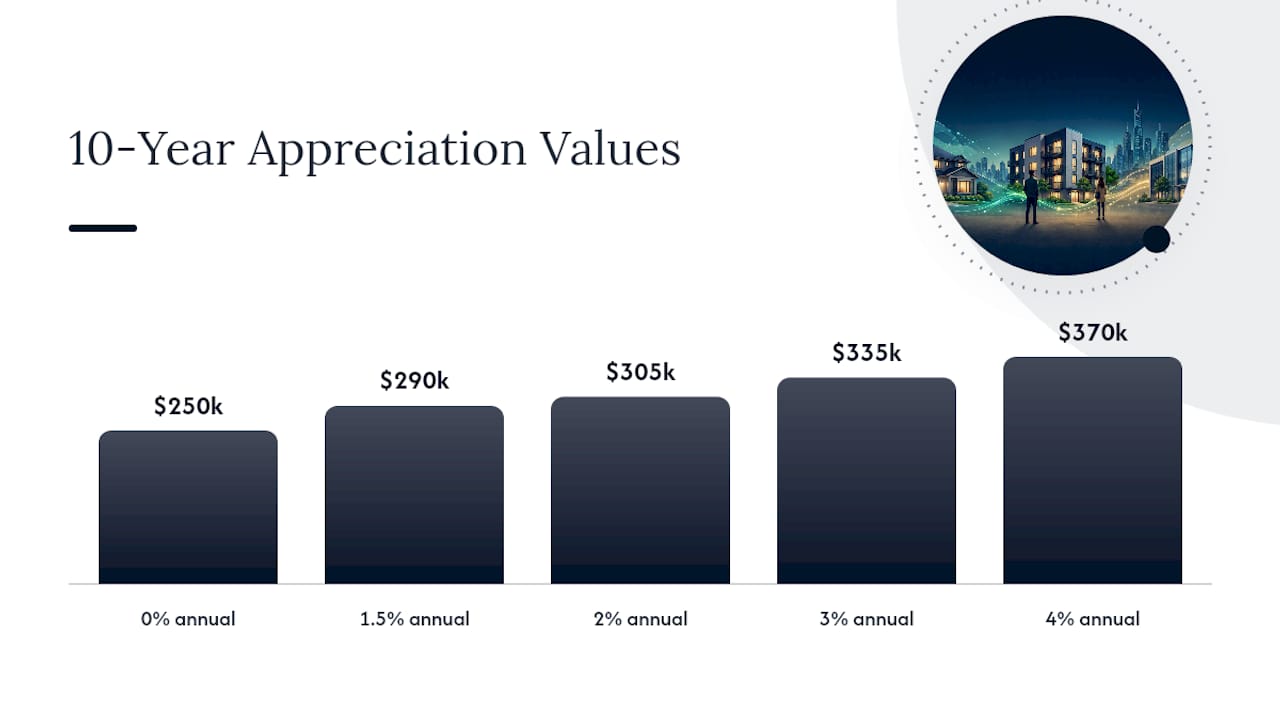
Because these forecasts carry real uncertainty, build sensitivity into your assumptions instead of picking one number. Model your deal at 0%, 2%, and 4% annual appreciation, and see how the outcome changes at each level. To convert a percentage into a dollar figure, multiply the current value by (1 plus your annual rate) raised to the number of years held, then subtract the original value. A $250,000 property appreciating at 3% annually is worth roughly $335,000 after ten years. Drop that assumption to 1.5%, and you’re closer to $290,000. That’s a $45,000 swing on one variable you can’t fully control.
Risk, Timing, and Predictability: What Actually Breaks a Plan
Cash-flow strategies fail operationally. Appreciation strategies fail on timing. Knowing which failure mode applies to your deal tells you what to guard against.
Cash-flow plays are vulnerable to vacancy stretches, unexpected repairs, management turnover, and rising rates that squeeze refinance options. These are day-to-day risks you manage through reserves and disciplined operations. Appreciation plays are vulnerable to market corrections, illiquidity when you need to sell, and cyclical downturns that hit right when your hold period ends.
A few structural realities shape both:
- Leverage amplifies whichever outcome you get. Debt boosts your return on a winning appreciation bet and deepens your loss on a losing one.
- Interest rate moves affect financing costs immediately and appreciation expectations indirectly, since higher rates typically cool buyer demand.
- Tax treatment differs: cash flow is taxed as ordinary income annually, while appreciation gains are usually deferred until sale and may qualify for capital gains treatment.
- Cash flow reduces forced-sale risk. A property that covers its own debt service doesn’t require you to sell during a downturn just to make payroll on your portfolio.
That last point matters more than most investors realize until they’ve lived through a rate spike. When interest rates rise, cash-flowing deals get harder to find, which pushes some investors toward appreciation bets with the plan to refinance once rates ease. That approach can work, but it demands larger reserves and a higher tolerance for being wrong about timing.
A Decision Framework for Picking the Right Strategy
Run every deal through investor-level and deal-level filters before you decide which strategy is actually appropriate.
Investor-level criteria to check first:
- What’s your actual goal: monthly income, long-term net worth, or both?
- How long is your realistic runway if a property underperforms for 12 to 18 months?
- What cash reserves do you have outside the deal itself?
- How much leverage are you comfortable carrying, and what’s your tax situation?
Deal-level criteria come next: set a minimum cash-on-cash return you’ll accept (many investors use 8% as a floor), a cap-rate threshold appropriate to the market, and a rough appreciation score based on the fundamentals covered above.
Simple rules help here. If your reserves are thin and you need income within 12 months, favor cash flow and reject anything below your cash-on-cash floor. If you have strong reserves, a five-plus-year horizon, and verified market fundamentals pointing up, appreciation can justify thinner monthly numbers.
Watch for red flags that signal a deal improperly leans on appreciation: negative cash flow “justified” by hoped-for rent growth, underwriting that skips vacancy allowances, or a seller’s pitch built entirely around “this area is about to take off.” A useful habit is to underwrite conservatively on cash flow and treat appreciation strictly as upside, which keeps weak deals from getting rescued by wishful thinking.
Pro Tip: Cross-check your cap rate and cash-on-cash number against the cap rate vs cash-on-cash guide before you commit; the two metrics tell you different things, and relying on just one can hide a weak deal.
Three Worked Scenarios That Show How the Math Actually Moves
Numbers settle arguments that opinions can’t.
- Scenario A: Steady cash flow, modest appreciation. Monthly cash flow of $300 after all expenses, cash-on-cash return around 9%. At 3% annual appreciation, the property reaches roughly $335,000 in value. Over ten years, you’ve collected $36,000 in cash flow plus built substantial equity through appreciation and principal paydown.
- Scenario B: Thin cash flow, high-appreciation market. Monthly cash flow of just $50, cash-on-cash return under 2%. If the market delivers 5% annual appreciation, the property could reach around $407,000, a much larger equity gain, but drop that assumption to 2% and it lands closer to $305,000, barely above what many similar cash-flow deals produce with far less risk.
- Scenario C: Value-add renovation. You buy at $200,000, put $40,000 into rehab, and raise the after-repair value to $290,000 while pushing rent up by $250 a month. That single move improves both sides of the ledger at once: better monthly cash flow and forced appreciation you didn’t have to wait on.
The takeaway across all three: small differences in appreciation assumptions compound over a decade more than a modest monthly cash-flow edge does, but they’re also the least reliable number in your model. Selling costs, refinance fees, and taxes eat into whichever gain you’re counting on, so run both sides before you decide which one the deal actually depends on.
Building a Portfolio That Uses Both
A portfolio built entirely around one strategy is a portfolio built around one risk. Mixing roles gives you monthly liquidity from cash-flow properties and long-term equity growth from appreciation plays, without betting the whole plan on either one working perfectly.
- Assign each property a specific job: income, growth, or both, and revisit that assignment annually.
- Convert an appreciation asset into an income asset through a cash-out refinance once it’s built enough equity, redeploying that capital into a cash-flowing purchase.
- Watch tax timing on any sale, since a 1031 exchange can defer gains if you’re rolling proceeds into another investment property.
- Balance management burden and geography. Concentrating every property in one metro raises your exposure to a single local downturn.
Tools to Test Your Own Numbers Before You Buy
Every scenario above starts with real inputs, not guesses. Run your own gross rent, vacancy, OPEX, and PITI through a rental property calculator and check the DSCR and cash-on-cash outputs against the thresholds covered earlier. For value-add and appreciation-through-rehab plays, an ARV calculator paired with a BRRRR calculator shows whether your rehab budget and refinance plan actually produce the equity you’re expecting.
| What to check | Why it matters |
|---|---|
| DSCR | Tells you if the property covers its own debt with margin to spare |
| Cash-on-cash return | Measures actual return on the cash you put into the deal |
| Break-even rent | Shows how much rent could drop before you lose money monthly |
Practical Rules I Use When Choosing Between Cash Flow and Appreciation
My rule of thumb: if a deal can’t stand on its own cash flow, appreciation should be supported by verifiable fundamentals rather than optimism. I size a portfolio so income-anchor properties outnumber growth bets, recognizing growth bets can test patience during downturns.
I accept weaker monthly numbers only when the appreciation thesis is supported by concrete evidence like documented job growth, permitting restrictions, or supply gaps.
— Michael
Run Your Own Numbers With Real Estate Investor Toolkit
Every example in this article started with a calculator, not a hunch, and that’s the difference between underwriting a deal and hoping one works out. Real Estate Investor Toolkit gives you free access to the same calculators used above, no sign-up required, so you can test a real address in minutes instead of building a spreadsheet from scratch.
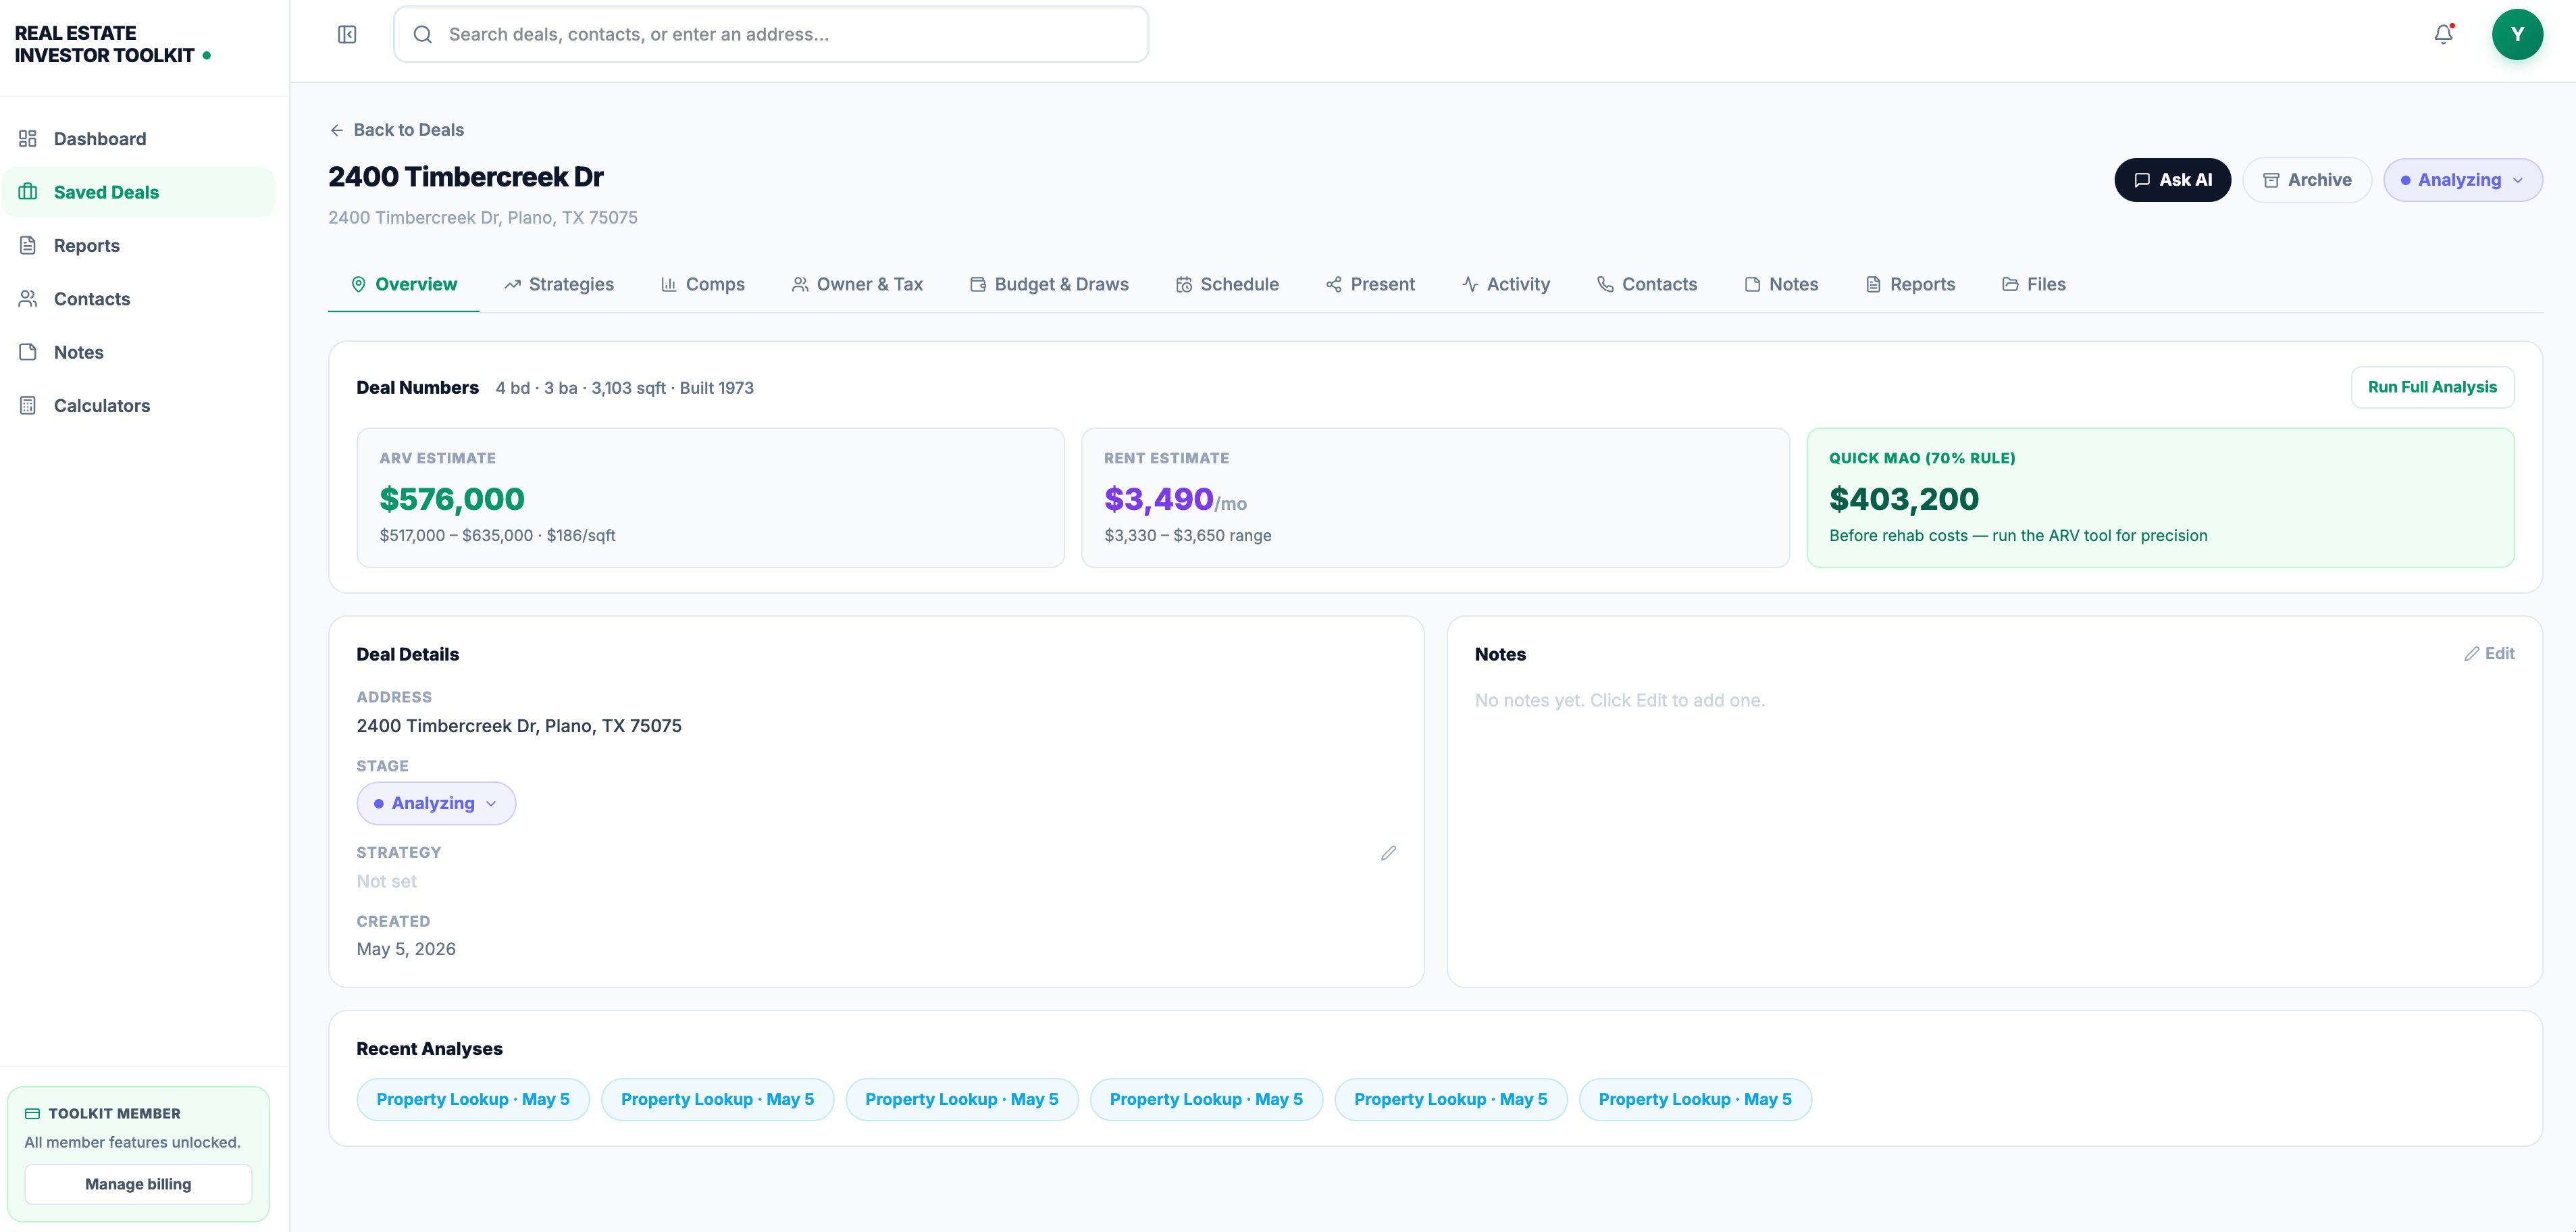
Plug your own numbers into the rental property calculator to check cash-on-cash return and DSCR before you make an offer. If the deal leans on a renovation or refinance play, the BRRRR calculator models the whole cycle, and the ARV calculator confirms your after-repair value estimate against real comps. Start with whichever number is driving your decision, and let the math confirm it instead of your gut.
Sources
- Cash flow definition — Investopedia
- Should You Invest for Cash Flow or Appreciation? (BiggerPockets)