Skip the Spreadsheet: Cap Rate Calculation for Investors, 2 Examples

Cap rate equals Net Operating Income divided by property value, then converted to a percentage. A property with $30,000 in NOI and a $400,000 value has a cap rate determined by dividing NOI by value, then converting to a percentage. NOI never includes your mortgage payment, which is exactly why two investors buying the same building can walk away with wildly different opinions about how well it performs.
TL;DR:
- The choice of property value—purchase price or current market value—significantly impacts the cap rate calculation, especially over time as values diverge.
- Net Operating Income should exclude debt service, taxes, and owner withdrawals, focusing solely on operating expenses and income, with adjustments for large capital expenditures.
- Vacancy rates in real-world conditions lower the effective gross income used in cap rate calculations, making pro forma estimates potentially overly optimistic.
- Good cap rates vary by market, property type, and risk level, with higher rates indicating higher expected returns but also increased risk.
- Cap rate alone cannot predict future rent changes or market shifts; it must be paired with other metrics like cash-on-cash return or IRR for a comprehensive investment assessment.
Table of Contents
- How Does the Cap Rate Formula Actually Work?
- What Counts as Net Operating Income?
- What Does a Cap Rate Calculation Look Like in Practice?
- How Do You Adjust NOI for Vacancy and Real-World Conditions?
- What Is a Good Cap Rate for a Rental Property?
- What Doesn’t Cap Rate Tell You?
- How Much Does a Cap Rate Shift Change a Property’s Value?
- A Practical Checklist Before You Trust a Cap Rate
- Run Your Cap Rate Numbers Without the Spreadsheet Guesswork
- Sources
How Does the Cap Rate Formula Actually Work?
The math itself is simple: Cap Rate = (Net Operating Income ÷ Current Market Value) × 100. Divide NOI by value, then multiply by 100 to turn the decimal into a percentage. That part rarely trips anyone up. Where investors get sloppy is deciding what number to plug in for “value” and which cap rate they’re actually tracking.
You have two choices for the denominator: purchase price or current market value. Right after closing, those two numbers are often close. Three years later, they diverge fast. If a property appreciated from $400,000 to $475,000 while NOI stayed flat, dividing by the original purchase price overstates your return. Appraisers and lenders lean on market value because it reflects what the asset is worth today, not what you paid for it a few years back.
There’s also a timing distinction worth knowing:
- Going-in cap rate uses the NOI at the moment of purchase against the purchase price. It tells you what you’re buying into on day one.
- Terminal cap rate (also called exit cap rate) is the rate you assume when modeling a future sale. Buyers underwriting a five-year hold typically assume the terminal cap rate will land higher than the going-in rate, since markets tend to soften over long horizons and buyers demand more cushion.
Commercial lenders and institutional buyers watch both numbers closely because a deal can look great going in and still lose money if the exit assumption is too optimistic. JPMorganChase notes that cap rate is best treated as a point-in-time snapshot rather than a permanent verdict on a property’s quality.
What Counts as Net Operating Income?
NOI is the number that makes or breaks a cap rate calculation, and it’s also the number most new investors build wrong. The formula: NOI = (Rental Income + Ancillary Income) − Operating Expenses. Get either half wrong and the resulting cap rate is meaningless, even if your math is technically correct.
Here’s how to build it step by step:
- Start with gross rental income. Total rent collected across all units for the year, annualized if you’re working from monthly figures.
- Add ancillary income. Laundry machines, parking fees, storage rentals, pet fees, and application fees all count.
- Subtract operating expenses. Property taxes, insurance, property management fees, repairs and maintenance, utilities paid by the owner, landscaping, and reserves for routine turnover.
- Stop there. Don’t touch debt service, depreciation, or income taxes. Those live outside NOI entirely.
JPMorganChase’s breakdown confirms this exact structure: NOI captures operating performance, not financing structure or ownership tax treatment.
The exclusions matter as much as the inclusions. Mortgage principal and interest never appear in NOI, because cap rate is designed to measure the property’s performance independent of how any specific buyer chooses to finance it. Owner draws and personal salary aren’t operating expenses either, even if you manage the property yourself. Capital expenditures, like a new roof or HVAC replacement, are trickier. Most analysts either exclude major one-time capex from NOI and treat it as a separate line item, or build a modest annual reserve into operating expenses to smooth out irregular big-ticket repairs.
Pro Tip: When you’re comparing a seller’s NOI to your own projection, check whether their number includes a capex reserve at all. Sellers routinely omit it to inflate NOI, which inflates the cap rate they’re advertising.
What Does a Cap Rate Calculation Look Like in Practice?
Numbers make this concrete faster than any formula explanation can. Here are two worked examples, one small and one with a vacancy adjustment baked in.
Example 1: Single-family rental.
- Monthly rent: $2,200 → annualized gross rent: $26,400
- Operating expenses (taxes, insurance, maintenance, management): $7,900
- NOI: $26,400 − $7,900 = $18,500
- Purchase price: $260,000
- Cap rate: $18,500 ÷ $260,000 = 7.1%
Example 2: Small multi-family with vacancy adjustment.
A four-unit building generates $144,000 in NOI at full occupancy against a $2,000,000 market value, giving a going-in cap rate of 7.2%, matching the LoopNet worked example of this exact scenario. But that 7.2% assumes zero vacancy, which almost never happens in the real world.
Dropping occupancy to 90% lowers the cap rate proportionally, reducing the income and thus the cap rate, which can impact the difference between advertised returns and actual performance.
How Do You Adjust NOI for Vacancy and Real-World Conditions?
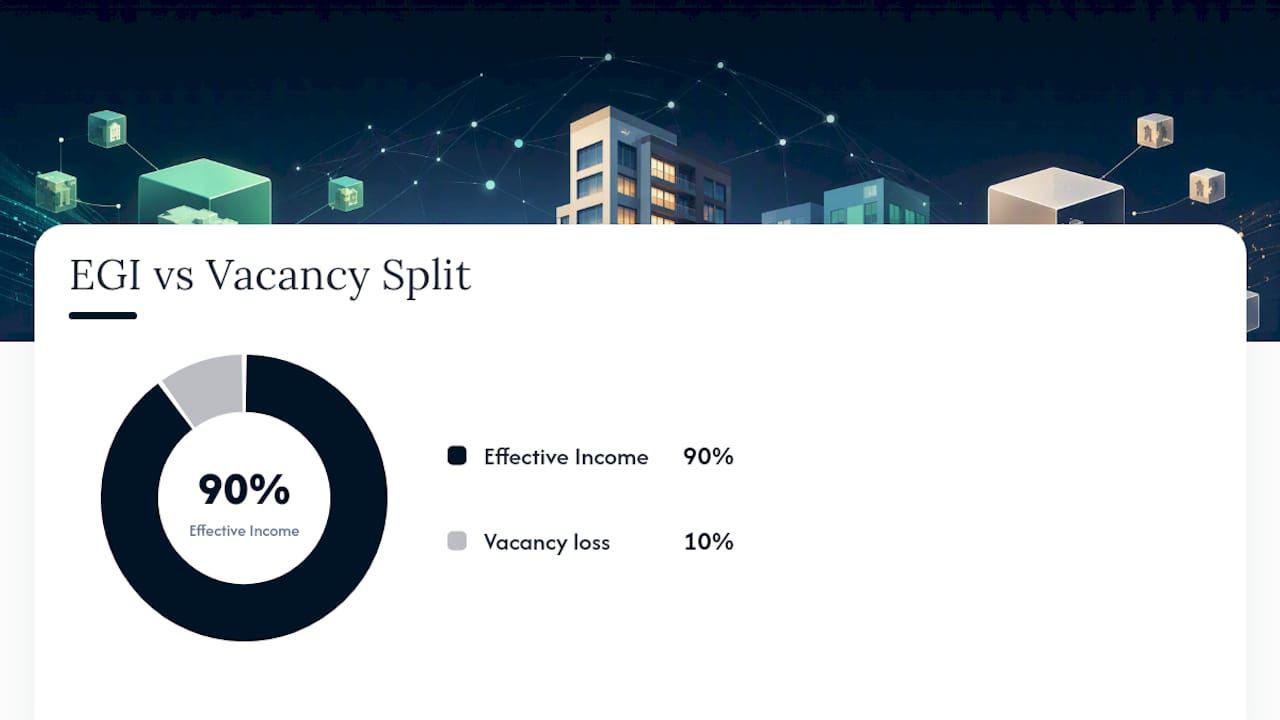
Raw gross rent is a fantasy number. No property sits at 100% occupancy forever, and lenders know it. Effective Gross Income (EGI) fixes this by subtracting a vacancy and credit-loss allowance from gross potential rent before you calculate expenses.
The adjustment process:
- Estimate a realistic vacancy rate based on the property’s actual leasing history or comparable properties in the submarket, not the number a seller hands you.
- Subtract vacancy and credit loss from gross rent to get EGI. A property with $240,000 in gross potential rent and a 10% vacancy factor produces $216,000 in EGI, matching the LoopNet occupancy example above.
- Decide how to treat capex. Routine repairs belong in operating expenses. Large one-time items, like a roof replacement, typically get pulled out and evaluated separately so they don’t distort a single year’s NOI.
- Choose trailing or pro forma NOI deliberately. Trailing twelve-month NOI reflects what actually happened. Pro forma NOI reflects what a broker or seller projects will happen once rents are raised to market or a vacant unit gets leased.
Pro Tip: Whenever a listing shows a “pro forma cap rate,” ask for the trailing twelve-month NOI too. The gap between the two numbers tells you how much of the deal’s promised return is speculation versus actual performance.
What Is a Good Cap Rate for a Rental Property?
There’s no universal “good” cap rate, because cap rate functions as a risk-reward barometer, not a report card. A higher cap rate generally signals higher expected return paired with higher perceived risk. A lower cap rate usually means a more stable asset in a stronger market, where buyers accept a smaller yield in exchange for lower volatility, a point JPMorganChase makes explicit in its cap rate framework.
Sample benchmark ranges illustrate the spread across asset classes. JPMorganChase’s market data puts national multifamily cap rates around 6.1% and office cap rates closer to 9.1%, though both figures shift by quarter and vary heavily by metro area. Treat any published range as a rough compass, not a rulebook. Local supply, tenant demand, and interest rate movement all push actual cap rates around within and beyond those bands.
The comparison only works when you’re comparing like-for-like:
- Same asset class (multifamily against multifamily, not multifamily against office)
- Similar lease structure (triple-net versus gross leases carry very different expense responsibilities)
- Comparable tenant quality and lease term
- Same general market or submarket
Skip any of those filters and a cap rate comparison stops meaning anything useful.
What Doesn’t Cap Rate Tell You?
Cap rate is a single-year, unlevered snapshot, and that framing matters more than most guides admit. It says nothing about how you’re financing the deal, what happens to your after-tax cash flow, or whether rents will climb or crater over your hold period.
Specific blind spots worth knowing before you rely on cap rate alone:
- Financing structure. Two buyers paying the same price with different loan terms will see completely different actual returns, even though the property’s cap rate is identical for both.
- Tax treatment. Depreciation, 1031 exchanges, and cost segregation can shift your real return well above or below what the cap rate implies.
- Future rent growth. Cap rate is backward or current looking, not predictive. It won’t tell you whether a submarket is about to boom or stagnate.
- Tenant credit risk. A single-tenant property leased to a national retailer carries different risk than one leased to a local mom-and-pop, even at an identical cap rate.
- Timing and market cycles, since Investopedia notes that cap rate works best as a comparison tool between similar properties, not as a standalone verdict on a deal.
Pair cap rate with cash-on-cash return to see how your actual invested cash performs, and consider IRR when you want a return figure that accounts for the full holding period and eventual sale. For a deeper look at how these metrics interact, our guide comparing cap rate, cash-on-cash, and the 1% rule breaks down when each one leads you to a different conclusion about the same deal.
How Much Does a Cap Rate Shift Change a Property’s Value?
Rearrange the formula and cap rate becomes a valuation tool: Implied Value = NOI ÷ Cap Rate. Since cap rate sits in the denominator, small shifts in the assumed rate produce outsized swings in implied value, which is exactly why buyers and appraisers argue over a half-point of cap rate as if real money were on the line. It is.
That’s the practical reason exit cap rate assumptions deserve as much scrutiny as your going-in numbers. If you’re underwriting a hold period and assuming rates compress by the time you sell, you’re betting on someone else paying more for the same income than you did.
A Practical Checklist Before You Trust a Cap Rate
Before I trust a listed cap rate, I run three quick checks. First, I rebuild the NOI myself from actual rent rolls and expense statements rather than accepting the seller’s number. Second, I look for red flags: unusually low expense ratios, one dominant tenant carrying the whole building, or a vacancy rate that doesn’t match the submarket. Third, if anything looks off, I run a sensitivity table across two or three cap rate and occupancy scenarios before going further into underwriting.
— Michael
Run Your Cap Rate Numbers Without the Spreadsheet Guesswork
This toolkit gets you from raw rent roll to finished cap rate in minutes, with no account required to start. The rental property calculator builds your NOI line by line, computes cap rate and cash-on-cash return side by side, and lets you toggle vacancy assumptions instantly so you can see the sensitivity table for yourself instead of rebuilding it by hand.
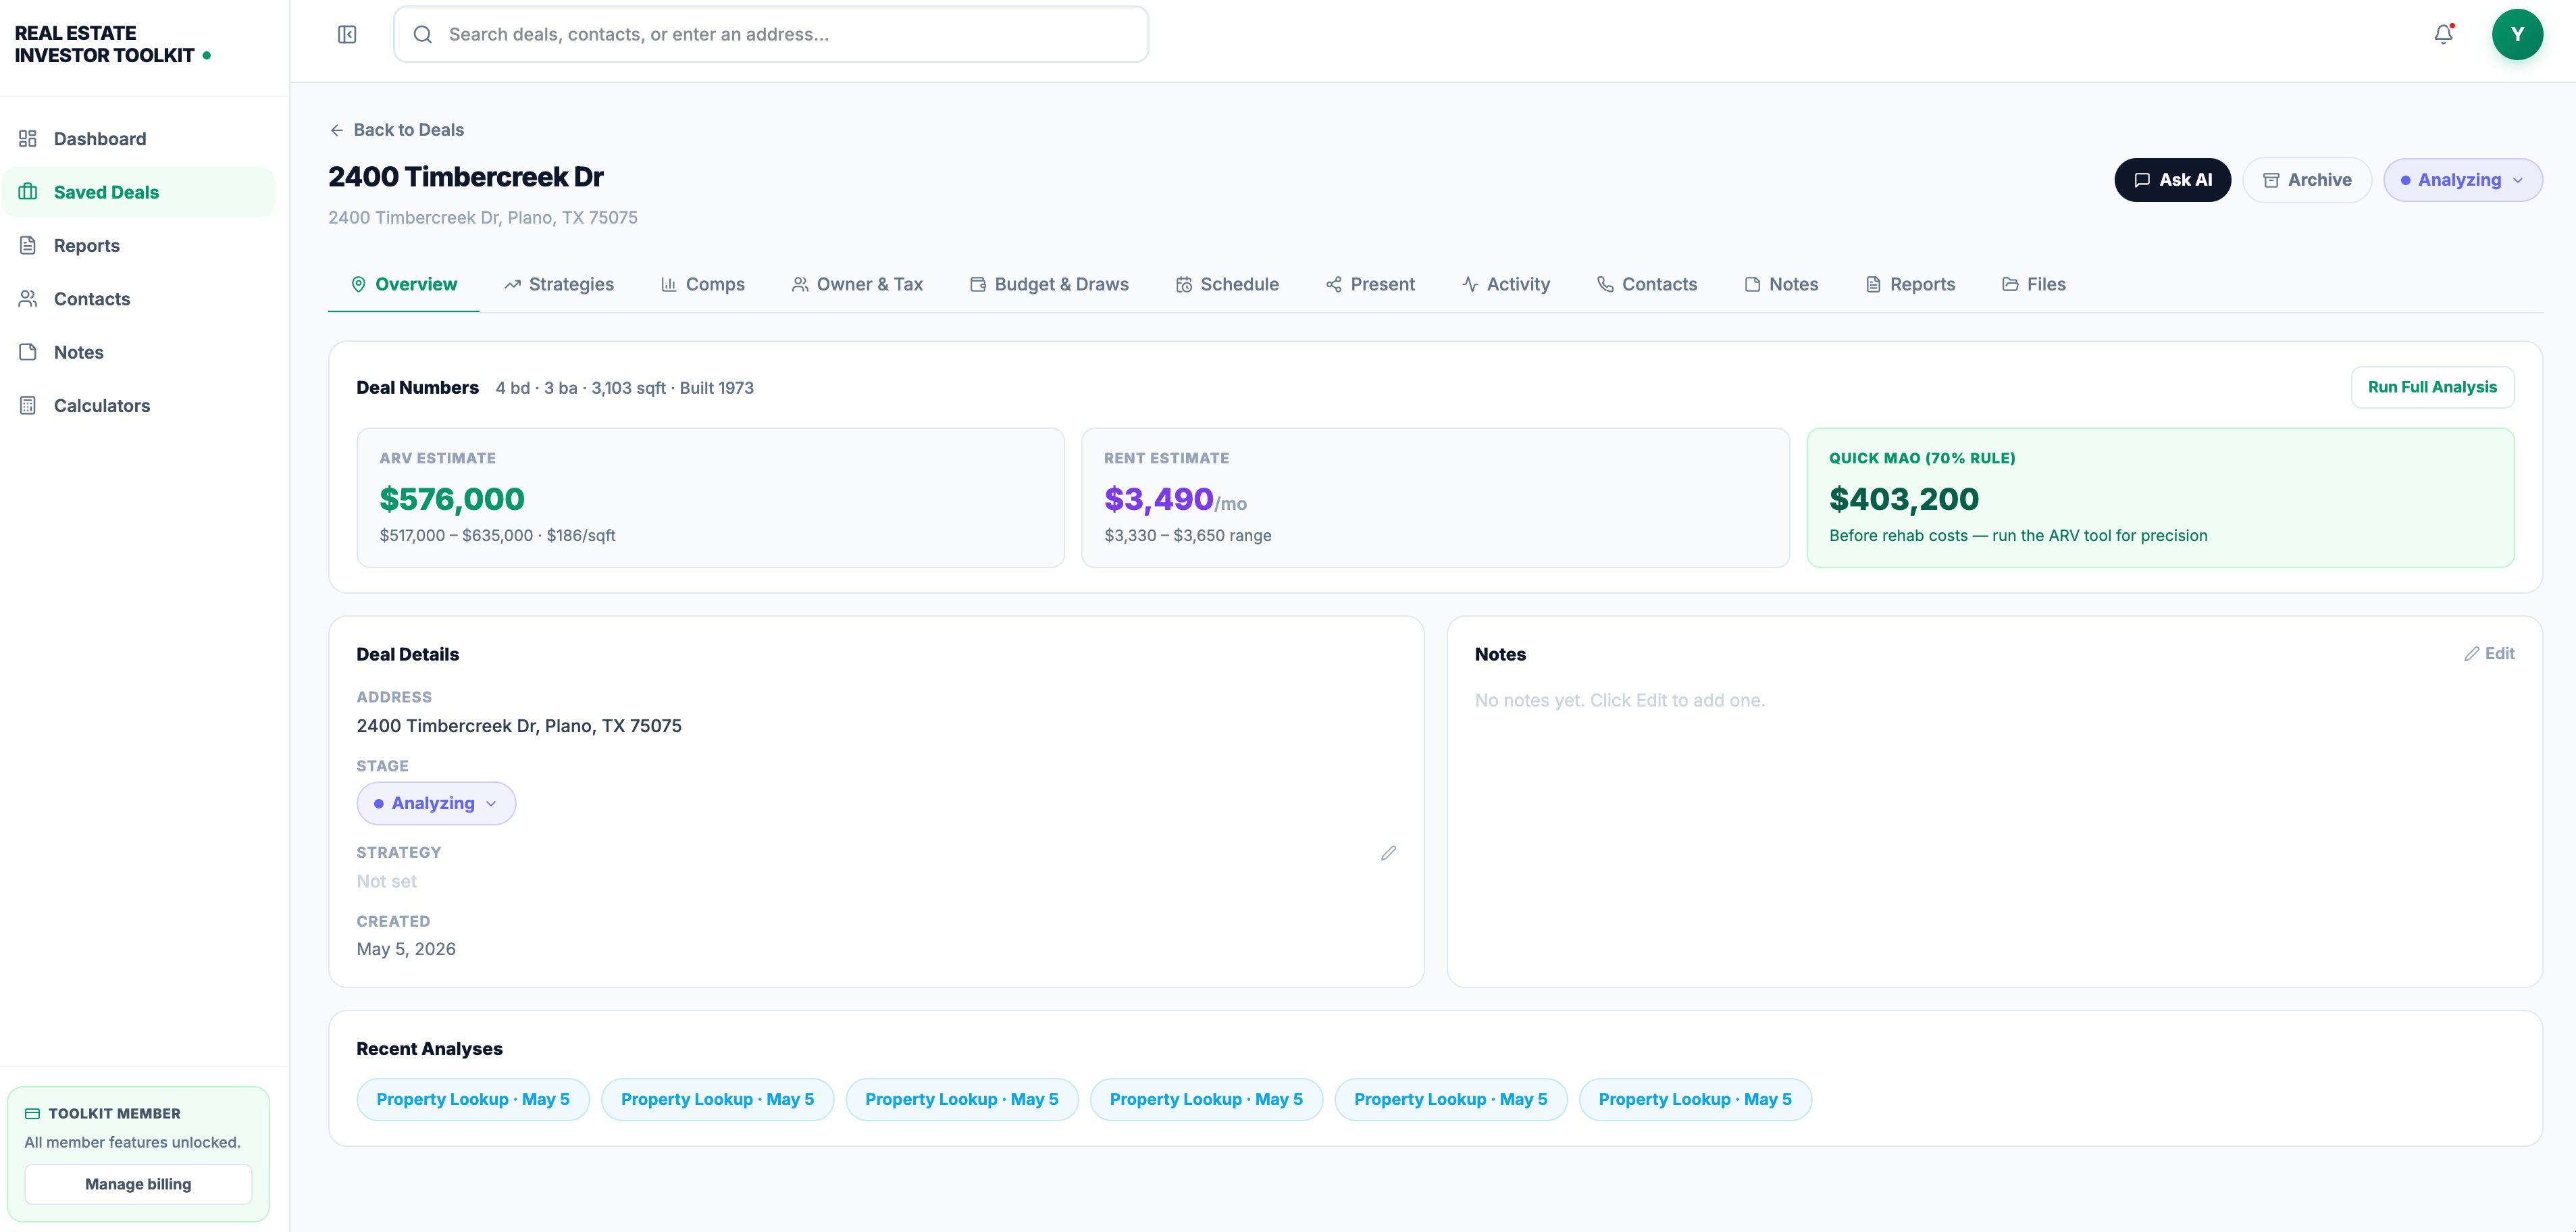
If financing is part of your decision, the investment property financing calculator shows how loan terms affect your actual cash return on top of the unlevered cap rate. Working a rehab-to-rent deal? Pair your NOI projection with the rehab cost estimator before you assume post-renovation rents. Many calculators are often free to run, so pull up your next deal and see the cap rate for yourself before you make an offer.
Sources
Definitions and formulas here draw from JPMorganChase’s cap rate guide, PNC Insights, LoopNet’s worked examples, and Investopedia’s cap rate entry. For related calculations, see how to analyze a rental property or try the net proceeds calculator from David Mordue.
- Cap Rates, Explained | JPMorganChase
- Capitalization Rate: Cap Rate Defined With Formula and Examples | LoopNet
- Capitalization Rate (cap rate) definition | Investopedia