Breakeven Occupancy: The Formula That Tells You When You’re Safe

Breakeven occupancy is the occupancy percentage a property needs to hit for its effective gross income to exactly cover operating expenses plus annual debt service. The formula is simple: Breakeven Occupancy = (Operating Expenses + Debt Service) ÷ Potential Gross Income. At that occupancy level, your DSCR sits at exactly 1.0x — you’re covering costs, but there’s nothing left over. Below it, you’re losing money every month.
Before you run the numbers, gather three figures:
- Annual operating expenses (taxes, insurance, maintenance, management, utilities)
- Annual debt service (principal and interest, annualized)
- Potential gross income at 100% occupancy, including rent and ancillary income
Once you have those three numbers, the calculation takes about thirty seconds.
Key Takeaways
Breakeven occupancy works because it converts operating expenses and debt service into a single occupancy percentage that shows exactly how much vacancy a property can absorb before it stops covering its own bills.
| Point | Details |
|---|---|
| Core formula | Breakeven occupancy equals operating expenses plus debt service, divided by potential gross income. |
| DSCR connection | At breakeven occupancy, DSCR sits at exactly 1.0x, which is why lenders require a buffer above it. |
| Typical ranges | Most practitioners treat 62% to 85% as reasonable, with hospitality trending lower than multifamily. |
| Biggest lever | Debt service adjustments, like refinancing or extending amortization, usually move the ratio the most. |
| Run it with Real Estate Investor Toolkit | The rental and financing calculators let you compute and stress-test breakeven occupancy without creating an account. |
Table of Contents
- What Does Breakeven Occupancy Actually Measure?
- How Do You Calculate Breakeven Occupancy Step by Step?
- What Does a Breakeven Occupancy Calculation Look Like in Practice?
- What Counts as a Good Breakeven Occupancy?
- How Do Lenders Use Breakeven Occupancy in Underwriting?
- Which Levers Actually Move Your Breakeven Occupancy?
- What Modeling Mistakes Distort Breakeven Occupancy?
- Why Most Breakeven Occupancy Advice Misses the Point
- How to Run Breakeven Occupancy Fast With Real Estate Investor Toolkit
- Sources
What Does Breakeven Occupancy Actually Measure?
Breakeven occupancy answers a different question than net operating income does. NOI tells you what a property earns before debt service. Breakeven occupancy tells you the minimum occupancy needed to service that debt without dipping into reserves or your own pocket.
That distinction matters because breakeven occupancy folds financing costs directly into the ratio, turning two separate expenses (operating and financing) into one occupancy percentage. It’s a survivability metric, not a profitability target. A property can hit breakeven occupancy and still be a mediocre investment. It just means the roof isn’t caving in.
Here’s who actually uses this number day to day:
- Lenders and underwriters, who want to see your cushion before approving a loan
- Asset managers, who track breakeven occupancy against actual occupancy every quarter
- Investors evaluating a deal, who use it as a first stress test before running full return models
How Do You Calculate Breakeven Occupancy Step by Step?
Getting the inputs right matters more than the math itself. Here’s the workflow:
- Calculate Potential Gross Income (PGI). Take total unit rents at full occupancy and add ancillary income like parking, laundry, or pet fees.
- Total your annual operating expenses. Include property taxes, insurance, repairs, management fees, and utilities not passed through to tenants.
- Determine annual debt service. Pull the total principal and interest payments for the year from your loan amortization schedule.
- Add OpEx and debt service, then divide by PGI. That result, expressed as a percentage, is your breakeven occupancy.
- Annualize everything. Mixing monthly OpEx with annual debt service is the most common error investors make.
A few borderline calls come up often. Do you include capital reserves in OpEx? Most conservative underwriters do, since reserves are a real cash outflow even if they’re not a monthly bill. Do you count expense recoveries (CAM reimbursements) as reducing OpEx or increasing PGI? Either works, as long as you’re consistent across deals so your comparisons hold up.
Pro Tip: *Run breakeven occupancy using annualized figures, not a single month’s snapshot. A property with seasonal vacancy or a one-time repair bill can look far riskier or safer than it actually is if you calculate from the wrong month.
What Does a Breakeven Occupancy Calculation Look Like in Practice?
Picture a 20 unit multifamily property with PGI of $300,000 a year. Annual operating expenses run $110,000, and annual debt service comes to $130,000.
- Operating expenses + debt service = $240,000
- $240,000 ÷ $300,000 PGI = 80% breakeven occupancy
That’s real breathing room. A vacancy spike, a bad quarter of collections, or a couple of units going dark for renovation won’t push you underwater.
Now stress it. A modest rent decline just ate more than four points of your cushion. That’s the kind of shift that turns a comfortable deal into a tight one, and it’s exactly why lenders ask for sensitivity runs at 5% and 10% rent declines before they’ll sign off.

What Counts as a Good Breakeven Occupancy?
Context decides whether a breakeven number is comfortable or alarming. Practitioners generally treat a range of 62% to 85% as reasonable, but where you land in that range depends heavily on asset type.
- Multifamily properties often run in the 65% to 80% range, given relatively stable demand and predictable expense structures.
- Hospitality assets, including short-term rentals, typically run lower breakeven thresholds because daily rate flexibility lets operators adjust pricing faster than a 12 month lease allows.
- Retail and office breakeven figures swing widely based on lease structure, tenant credit quality, and how much of the space carries long term leases versus short term exposure.
What matters more than the raw number is the gap between breakeven occupancy and actual market occupancy. A property with an 80% breakeven in a submarket running at 95% occupancy has real margin. That same 80% breakeven in a submarket sliding toward 82% occupancy should make you nervous, and it’s worth renegotiating price or terms before you close.
How Do Lenders Use Breakeven Occupancy in Underwriting?
That’s the point where income exactly matches obligations, with zero margin for a bad month.
When you package a loan request, don’t just hand over a single breakeven figure. Show the underwriter your sensitivity scenarios at current occupancy, at a 5% rent decline, and at a 10% decline. A DSCR calculator built for rental properties can help you translate those occupancy scenarios into the coverage ratios your lender actually cares about.
Which Levers Actually Move Your Breakeven Occupancy?
Four levers affect breakeven occupancy, and they don’t move the needle equally. Here’s how they rank in most deals:
- Debt service usually has the biggest impact. Refinancing to a lower rate or switching from a 20 year to a 30 year amortization schedule can shave several points off breakeven occupancy in one move.
- Achievable rents come next. Pushing PGI higher through renovation, better unit mix, or added ancillary income (parking, storage, pet fees) directly shrinks the ratio’s denominator.
- Operating expenses matter, but cutting them too aggressively risks deferred maintenance that costs more later. Target the controllable lines, like management fees and vendor contracts, before touching anything structural.
- Purchase price negotiation affects breakeven indirectly, by lowering the loan amount and therefore debt service, which loops back to lever one.
Renegotiate the price or walk. A property that only works on paper with unrealistic assumptions usually doesn’t work in year two either.*
Sometimes the right move is accepting a lower return in exchange for a safer breakeven, particularly in a market where rent growth has stalled. Other times, the math simply won’t get there, and that’s useful information before you wire earnest money, not after.
What Modeling Mistakes Distort Breakeven Occupancy?
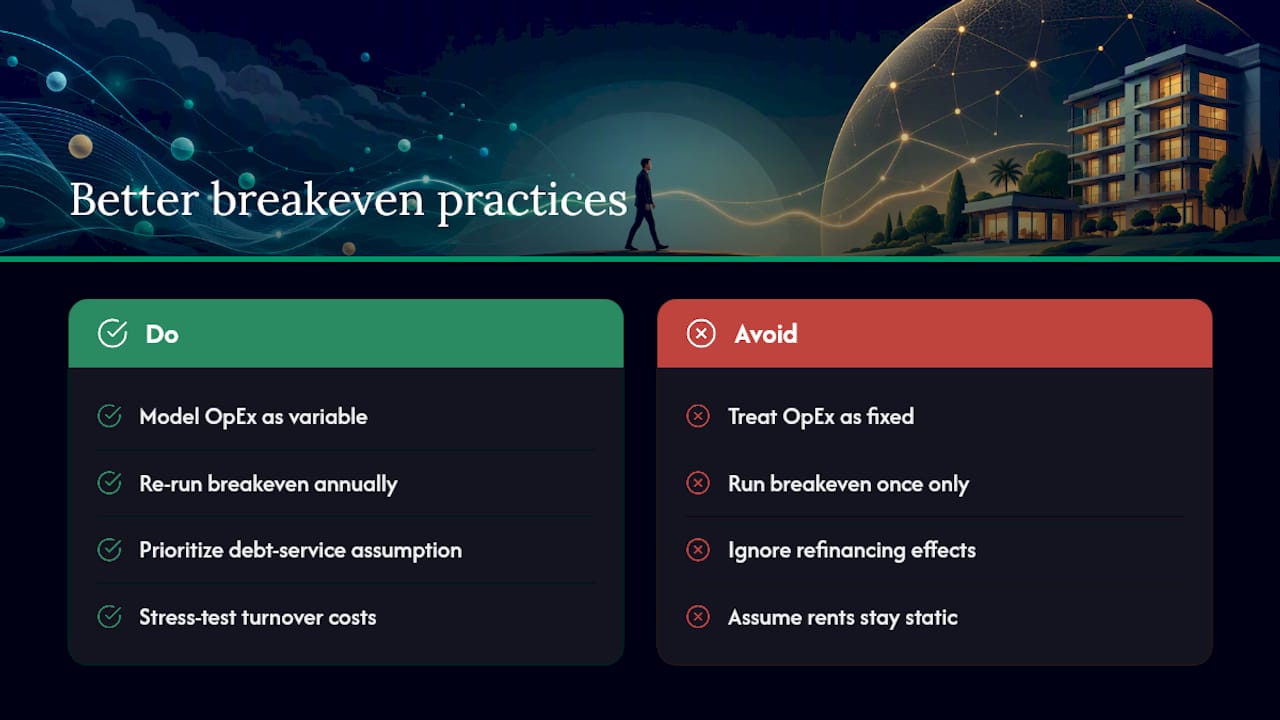
The single biggest error is treating every operating expense as fixed. Utilities, common area maintenance, and even some management fees are semi-variable. Costs like utilities can fall 5% to 10% at lower occupancy, since a vacant unit uses less water and electricity. Modeling all OpEx as fixed inflates your breakeven occupancy and makes a workable deal look riskier than it is.
Definitional drift causes the second most common problem. Leased occupancy, economic occupancy, and physical occupancy tell three different stories, and mixing them mid-analysis produces numbers that don’t reconcile.
Before you trust a breakeven figure, run three checks:
- Compare your breakeven number against comparable properties in the comps analysis for the submarket
- Re-run the calculation at 5% and 10% rent declines to see how fast the cushion disappears
- Sanity check OpEx against a detailed holding cost breakdown rather than a rough annual estimate
Why Most Breakeven Occupancy Advice Misses the Point
Most explainers stop at the formula and call it a day. That’s a mistake, because the formula is the easy part. The real skill is in how you treat the inputs, especially operating expenses, which almost nobody models honestly.
Investors default to treating OpEx as a fixed number because it’s simpler. But real properties don’t behave that way. Utilities drop when units sit empty. Turnover costs spike when occupancy is volatile. A breakeven occupancy calculated with rigid, unrealistic expense assumptions gives you false confidence in one direction or unnecessary panic in the other.
The second thing conventional advice underweights: breakeven occupancy is only useful as a moving target, not a one time calculation you run at acquisition and file away. Rent rolls change. Rates get refinanced. Expense lines creep upward with inflation. If you’re not re-running the number annually, or after any material change to debt or rent structure, you’re underwriting against stale data.
What should you prioritize first? Get your debt service assumption right before anything else. It’s the single lever with the most leverage over the ratio, and it’s the one most investors treat as fixed when it’s actually negotiable at acquisition and adjustable later through refinancing.
How to Run Breakeven Occupancy Fast With Real Estate Investor Toolkit
Running this math by hand works fine for one property. It gets tedious fast once you’re comparing five deals or re-testing sensitivity scenarios on a property you already own. Real Estate Investor Toolkit’s calculators handle the annualizing, the division, and the scenario testing so you can focus on judgment calls, not spreadsheet formulas.
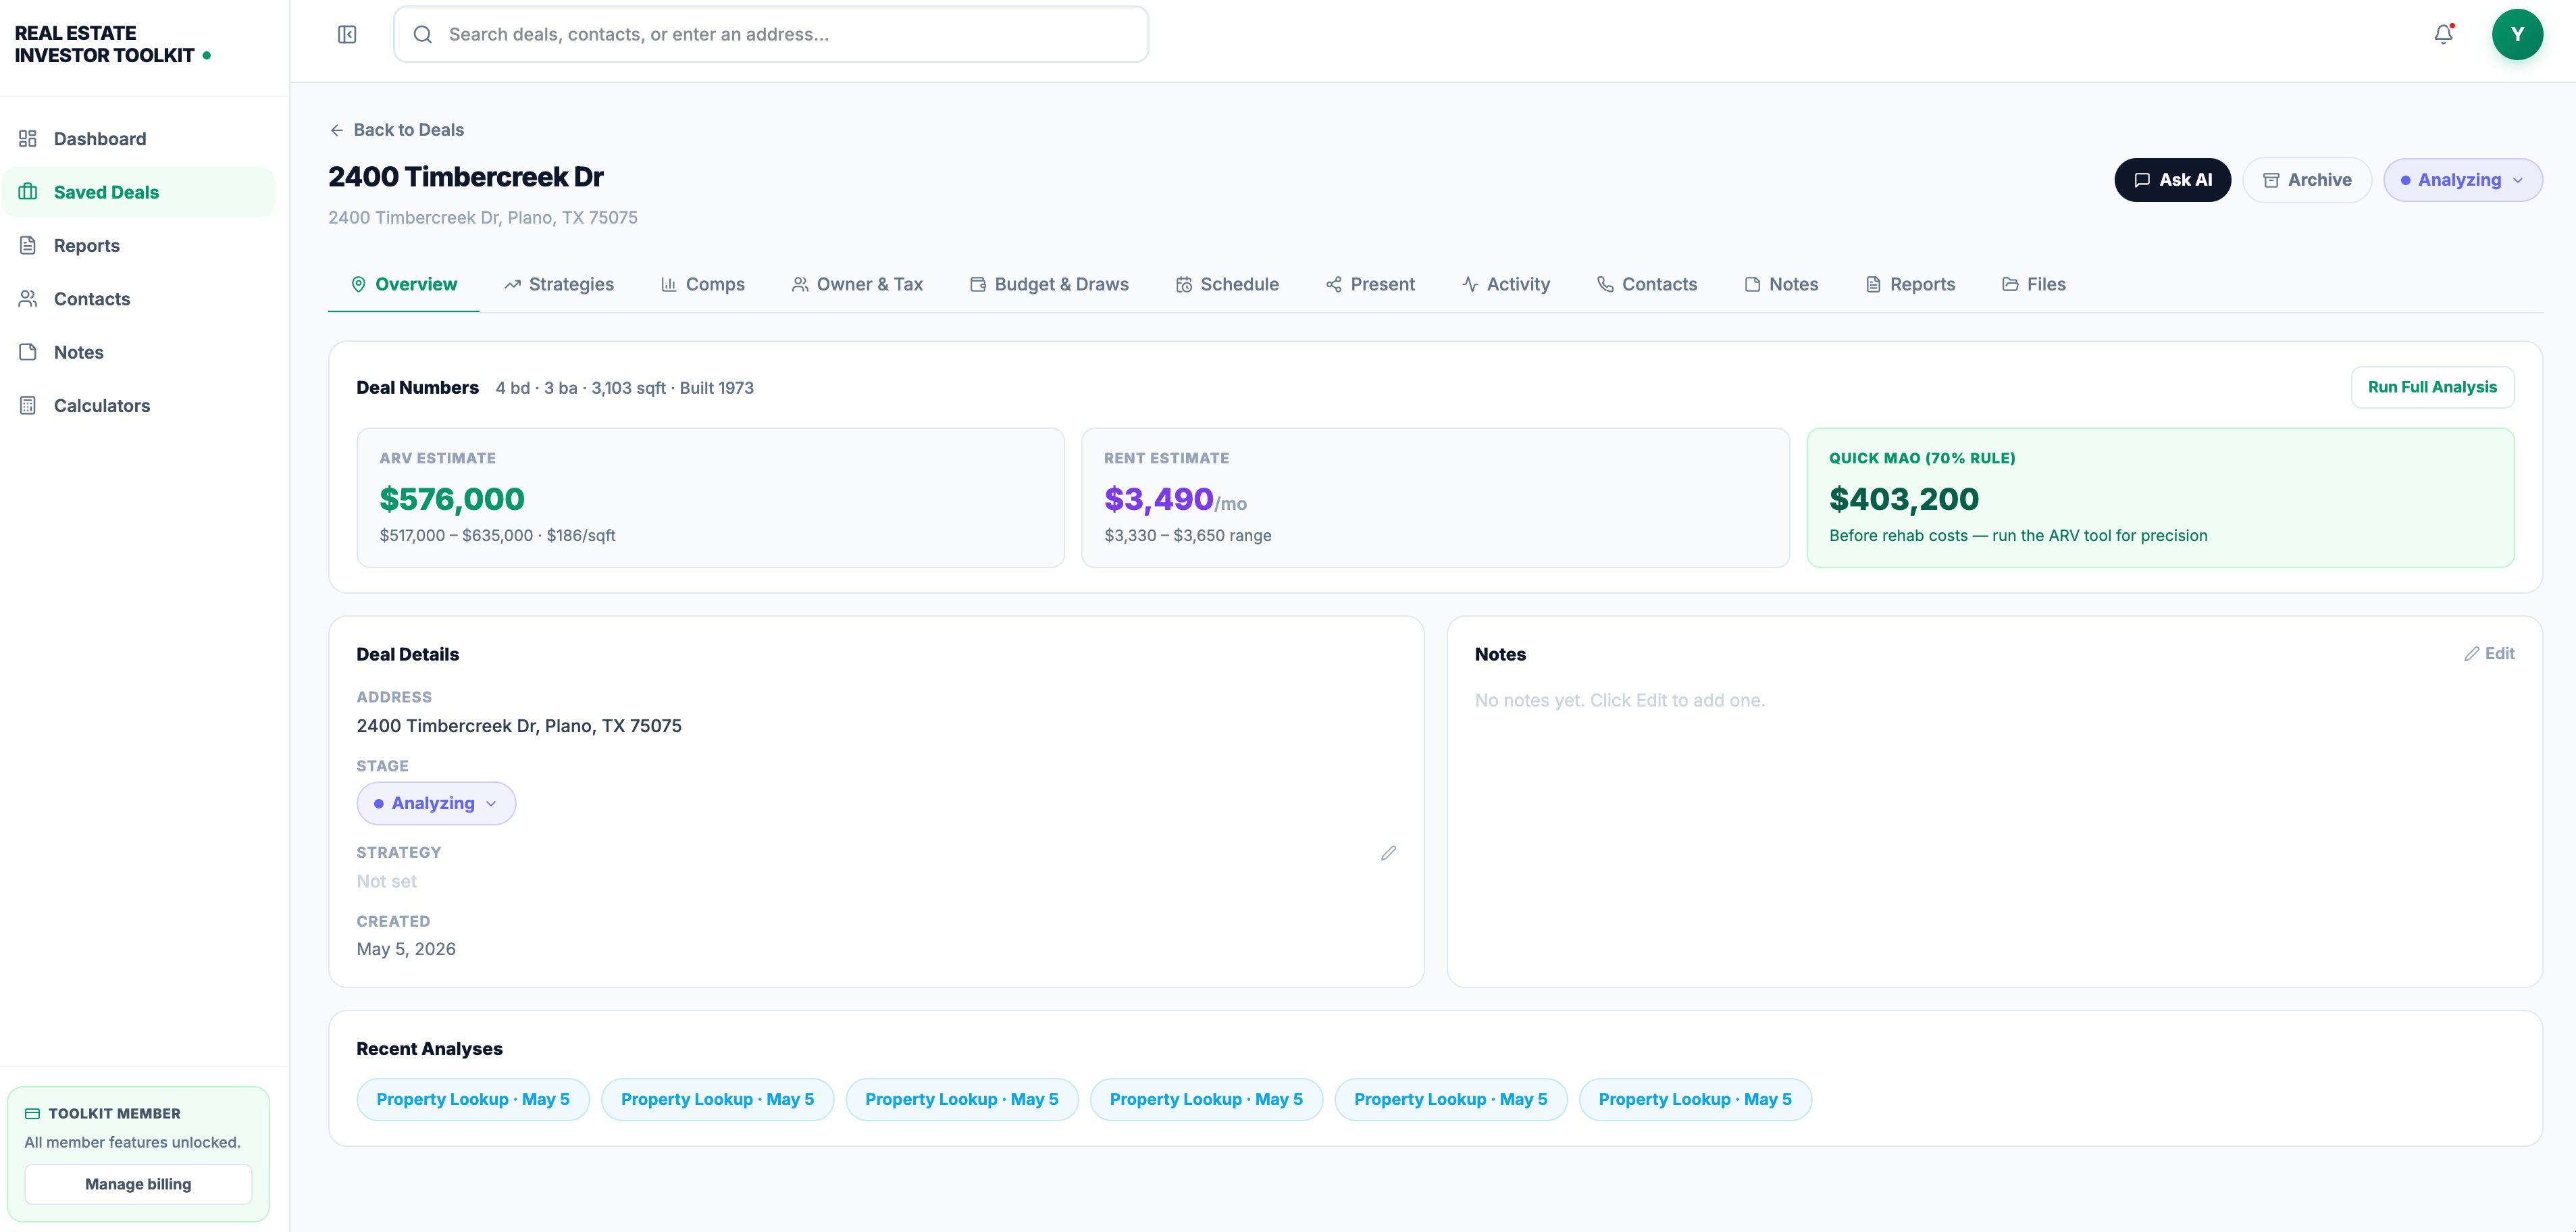
Start with the rental property calculator to pull together your PGI, OpEx, and cash flow inputs in one place. Then use the investment property financing calculator to generate accurate annual debt service figures straight from your loan terms, rather than estimating from a monthly payment. Neither tool requires an account to run a quick check, which matters when you’re evaluating three deals back to back and don’t want to create logins for each one.
For a broader walkthrough of underwriting metrics that pair well with breakeven occupancy, the learning hub covers cap rate, cash-on-cash return, and the 1% rule in more depth.
Sources
- The Breakeven Occupancy in Multifamily Real Estate - Willowdale Equity
- Breakeven Occupancy in CRE: Definition, Formula & Examples | Cove Glossary
- Multifamily break-even analysis (LoopNet)
Recommended
- Rental Property Calculator — Cash Flow, Cap Rate & ROI | Real Estate Investor Toolkit
- How to Analyze a Rental Property: Cash Flow, Cap Rate, and the 1% Rule — Real Estate Investing Guide | Real Estate Investor Toolkit
- When the 70% Rule Works, When It Breaks, and What to Use Instead — Real Estate Investing Guide | Real Estate Investor Toolkit
- Real Estate Investing Guides, Frameworks, and Strategies | Real Estate Investor Toolkit