How to Analyze Rental Comps and Set a Defensible Rent

Analyzing rental comps means pulling five to ten recently leased units that match your subject property, normalizing each to price per square foot, adjusting for real differences like parking or condition, and landing on the median rather than the average. That median, adjusted for your unit’s specific features, becomes your defensible market rent. Skip any of those steps and you’re guessing with extra math attached.
Here is the six-step version you can run on any property in about an hour:
- Collect 5 to 10 comps from at least two sources, matched by bedroom count and unit type.
- Filter to units within 20% of your square footage, within a mile, leased or listed in the last 60 to 90 days.
- Normalize every comp to dollars per square foot, then multiply by your unit’s square footage.
- Adjust for amenities, condition, and concessions using dollar figures, not gut-feel percentages.
- Take the median of your adjusted set, not the mean. One overpriced listing shouldn’t drag your number up.
- Test it with a short listing window or tiered pricing before committing to a full-year lease.
If you have 15 to 60 minutes right now, do this before anything else:
- Pull multiple active listings within a mile of your property that match bedroom count.
- Note whether prices are asking rents or actual leased rents. That distinction changes everything downstream.
- Calculate the price per square foot for each one so you have a baseline before you touch a spreadsheet.
Key Takeaways
Analyzing rental comps accurately means pulling multiple recent comps, normalizing them to price per square foot, adjusting with real dollar figures, and taking the median before you ever set a listing price.
| Point | Details |
|---|---|
| Minimum comp count | Aim for at least five comps; fewer than that means widening filters and documenting added uncertainty. |
| Normalize before comparing | Convert every comp to $/sqft first, then scale to your subject’s exact square footage. |
| Use dollar adjustments | Adjust for amenities and concessions in fixed dollar amounts, not vague percentages. |
| Document everything | Record source, pull date, and adjustment logic so the number holds up to lender or appraiser review. |
| Formalize with a calculator | Real Estate Investor Toolkit’s free Rental Property Calculator and Comps Analyzer turn adjusted comps into a saved, exportable underwriting record. |
Table of Contents
- What Rent Comps Are and Why the Analysis Matters
- The Step-by-Step Workflow for Rental Comps Analysis
- Where to Find Rental Comps and Which Tools Actually Help
- How to Adjust Comps for Real Differences
- The 1% Rule, 2% Rule, and Other Shortcuts: When They Help and When They Lie
- Where Comp Analysis Goes Wrong (and How to Catch It)
- Setting the Final Rent and Knowing When It’s Drifting
- Turning Your Comp Set Into Underwriting Numbers
- Speed Versus Rigor: When a Fast Estimate Is Fine and When It Isn’t
- Try the Free Calculators Behind This Comp Workflow
- Frequently Asked Questions
- Sources
What Rent Comps Are and Why the Analysis Matters
A rent comp is a nearby, similar unit’s actual or asking rent, used as a reference point for pricing your own property. “Similar” means matched bedroom count, comparable square footage, and a location close enough that the same renters would consider both units. The core technique investors rely on is normalizing every comp to price per square foot, then scaling that rate to the subject unit’s exact size, because two three-bedroom units can differ by 400 square feet and renting them at the same flat rate leaves money on the table or scares off applicants.
The stakes are bigger than a monthly number. Overestimate market rent by even $75 a month and you distort your net operating income, your cap rate, and ultimately your offer price on the deal. A property modeled at $2,200 a month that actually leases at $2,050 doesn’t just cost you $150 a month. It compounds into a valuation gap that shows up when a lender or appraiser pulls their own comps and doesn’t match yours.
That gap is exactly why rent estimates need a paper trail. Local market conditions can shift within blocks, not just neighborhoods, so a comp set that ignores hyper-local variation will systematically mislead you no matter how many listings you collect. Two units a quarter-mile apart, on different sides of a school district boundary or a busy road, can rent for materially different amounts even with identical square footage.
Pro Tip: When you present a rent assumption to a lender, partner, or property manager, disclose your sample size, the date range of your comps, and exactly how you adjusted for differences. A rent number with no methodology behind it invites pushback; one with three sentences of documentation usually doesn’t.
- Rent comps work because they anchor your number to what real tenants are actually paying nearby.
- $/sqft normalization corrects for the fact that few comps match your exact square footage.
- Sloppy comp work shows up later as a valuation gap, not just a leasing headache.
The Step-by-Step Workflow for Rental Comps Analysis
This is the process to run every time, whether you’re pricing a single-family rental or underwriting a fourplex acquisition.
Step 1: Define your subject property’s attributes. Write down unit type, bedroom and bathroom count, square footage, parking situation, laundry setup, and pet policy. You can’t filter comps accurately if you haven’t nailed down what you’re comparing against.
Step 2: Collect listings and lease records from multiple sources. Pull from listing sites, public records, and at least one paid data source if you have access. Document the date you pulled each comp; more recent comps are worth more than older ones.
Step 3: Filter aggressively. Match bedroom count exactly, keep square footage within roughly 20% of your subject, stay within half a mile in urban areas (expanding to a mile or more in suburban and rural markets), and favor comps leased or listed within the past 60 to 90 days. Older data works only if you explicitly flag the extra uncertainty it introduces.
Step 4: Normalize to $/sqft and calculate the median. Divide each comp’s rent by its square footage to get a $/sqft rate, then take the median rate across your filtered set (median beats average here because it resists distortion from one outlier listing). Multiply that median $/sqft by your subject’s square footage to get a baseline rent.
Step 5: Apply dollar adjustments for real differences. Add or subtract fixed dollar amounts for in-unit laundry, parking, updated finishes, better views, or active concessions at the comp property. Percentage adjustments feel intuitive but hide the actual math; dollar adjustments force you to justify each one.
Step 6: Compute a range and pick a number with a documented confidence level. Your low, mid, and high estimates come from applying conservative and aggressive adjustment assumptions to the same comp set. This full approach, pulling from multiple sources and filtering by bedroom count, square footage, distance, and recency before adjusting for condition and amenities, is what separates a defensible number from a guess.
Worked example: Your subject is a 1,050 sqft two-bedroom. Five comps within a mile, leased in the last 60 days, show a median rate of $1.85/sqft. That’s a baseline of $1,942.50. Your unit has in-unit laundry (add $60) and no covered parking (subtract $40 versus a comp average that includes parking). Adjusted rent: roughly $1,962.
| Filter Criteria | Recommended Range |
|---|---|
| Bedroom match | Exact match required |
| Square footage | Within ±20% of subject |
| Distance (urban) | 1 mile |
| Recency | 60 to 90 days |
| Minimum comp count | 5 comps |
Small adjustment errors compound fast: experts note that a $75 monthly swing in a rent assumption can materially change a property’s cash-on-cash return, which is exactly why the median and the dollar-based adjustments matter more than they seem to on paper.
Keep a simple spreadsheet checklist: address, beds/baths, sqft, $/sqft, adjustments applied, adjusted rent, source, and pull date. That’s your audit trail if anyone ever questions the number.
Where to Find Rental Comps and Which Tools Actually Help
You have five realistic sources: rental listing sites, MLS access (if you or an agent have it), direct calls to local property managers, public records, and paid rent-estimate services or APIs. Each one trades off coverage, accuracy, and cost differently.

Listing sites are free and give you volume, but they show asking rent, not leased rent, and a unit that’s been listed for six weeks straight is quietly telling you its price is too high. Comparing listing duration against actual leasing activity is one of the more useful signals investors overlook: a fast-leasing comp reflects real market demand, while a stale one reflects wishful pricing.
Public records give you lease-level detail in some markets, though availability varies widely by county and state. Paid rent-estimate services and APIs cost money but often deliver normalized $/sqft calculations and outlier removal already built in, which saves time if you’re running comps across a portfolio rather than a single deal. Property managers and local agents remain the most underused resource. A five-minute call with someone who’s leased three units on the same block in the last quarter often beats an hour of scrolling listing sites.
Pro Tip: Never rely on one source. Cross-reference at least two, ideally three, because listing sites, public records, and paid services each carry blind spots that only show up when you compare them side by side.
If your comp count comes back thin, that’s a real problem, not a rounding error. When inventory is thin, expand your distance and recency bands, and document the added uncertainty explicitly rather than forcing a confident number out of four mismatched listings. A step-by-step guide to pulling comps for investment properties can help you build that source-mixing habit into a repeatable checklist.
How to Adjust Comps for Real Differences
Percentage adjustments are a trap. Saying a comp is “10% nicer” tells you nothing you can defend to a lender. Dollar adjustments force specificity: you’re saying this exact amenity is worth this exact amount per month, based on what similar units with and without it actually rent for.
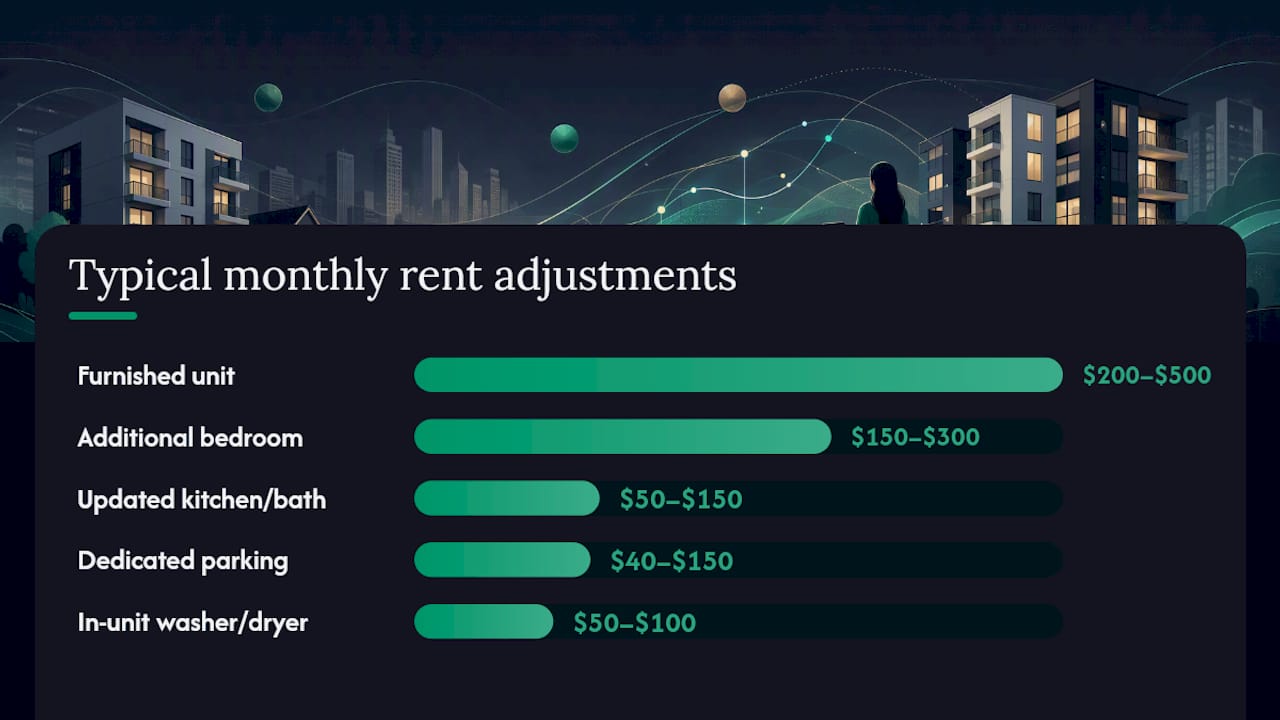
Start with a baseline set of adjustment ranges, then tighten them using your own local comps once you have enough data:
| Feature Difference | Typical Monthly Adjustment |
|---|---|
| In-unit washer/dryer | +$50 to $100 |
| Dedicated parking spot | +$40 to $150 (market-dependent) |
| Additional bedroom | +$150 to $300 |
| Updated kitchen or bath | +$50 to $150 |
| Premium floor or view | +$25 to $75 |
| Furnished unit | +$200 to $500 |
| Active concession (free rent, gift card) | Subtract full monthly-equivalent value |
Worked example on a 3BR subject at 1,200 sqft: your median comp rate is $1.75/sqft, giving a baseline of $2,100. The subject has in-unit laundry (+$75) but lacks a parking spot that most comps include (subtract $60). One comp in your set is currently offering half a month free, which effectively lowers its true rent by roughly $90/month spread across the lease term. Once you strip that concession out of the comp before calculating your median, your adjusted rent lands closer to $2,115 instead of an inflated number pulled from a comp that isn’t really charging what it appears to charge.
That concession detail matters more than most investors realize. A comp advertising $1,950 with two months free isn’t actually a $1,950 comp. It’s closer to $1,625 once you spread the discount across a 12-month lease, and skipping that math is one of the fastest ways to overprice your own unit against phantom competition.
Pro Tip: Build your adjustment table once, then reuse it. Tweak the ranges every quarter based on what your own local comps show, rather than rebuilding it from scratch on every deal.
If condition differences are driving a big chunk of your adjustment, it’s worth checking whether a rehab scope calculation changes the picture. Sometimes a $150/month rent gap closes with a $4,000 kitchen refresh, and that math belongs in your acquisition model, not just your rent adjustment.
The 1% Rule, 2% Rule, and Other Shortcuts: When They Help and When They Lie
These heuristics exist to filter deals fast, not to replace your comp work.
- The 1% rule: monthly rent should be at least 1% of purchase price. A $200,000 property should rent for roughly $2,000.
- The 2% rule: a stricter version, mostly relevant in lower-cost markets where cash flow needs to be higher to compensate for other risks.
- The 50% rule: assume 50% of gross rent goes to operating expenses, excluding debt service.
- Cap rate: net operating income divided by purchase price, used to compare deals independent of financing.
- GRM (gross rent multiplier): purchase price divided by annual gross rent, a rough speed check before deeper analysis.
Every one of these numbers ignores something that determines whether a deal actually cash flows: property taxes, insurance, maintenance reserves, vacancy allowance, and your actual financing terms. These heuristics work as screening tools, not underwriting tools, and treating a 1% rule pass as green light to make an offer skips the exact work this article walks through.
Relying on the 1% rule alone means ignoring the variables that actually determine whether a property generates positive cash flow. A property can clear the 1% rule and still lose money once real taxes, insurance, and vacancy are factored in.
Use these rules as a five-second filter to decide whether a deal is worth 20 minutes of comp analysis, never as the final word on whether to make an offer. If a property clears the 1% rule, that’s your green light to move on to the actual comp-based rent estimate and a full expense model, not a substitute for either one. Our guide to analyzing a rental property beyond the 1% rule walks through exactly where these shortcuts stop being useful.
Where Comp Analysis Goes Wrong (and How to Catch It)
Most bad rent estimates trace back to one of five repeatable mistakes.
- Relying on a single data source instead of cross-referencing two or three.
- Mixing asking rents and leased rents in the same comp set without flagging the difference.
- Skipping $/sqft normalization and comparing raw rent numbers across units of different sizes.
- Ignoring concessions, which quietly inflate the effective rent a comp appears to command.
- Using comps older than 90 to 120 days without adjusting for market movement since then.
Rent control adds another wrinkle worth flagging separately: if any comps in your set sit in a rent-controlled or rent-stabilized building and your subject property doesn’t, that comp’s rent may reflect regulatory caps rather than open-market demand. Exclude those comps or adjust them explicitly rather than blending them into your median.
Run these checks before you trust your number:
- Confirm you have at least five comps; fewer than that means widening your filters or flagging real uncertainty.
- Compare your median against the mean. A big gap between the two signals an outlier is skewing your data.
- Recalculate with a tighter radius and shorter recency window; if your number barely moves, that’s a good sign your estimate is stable.
- Check whether any comp’s listing has sat active for more than 45 days, which usually means it’s priced above market.
- Verify at least one comp reflects an actual leased rent, not just an asking price.
Pro Tip: When your comp count drops below five, don’t force confidence you don’t have. Widen your distance or recency bands, and write down explicitly that your estimate carries more uncertainty than usual. A documented “low confidence, $50 buffer applied” note is worth more than a false-precision number.
Setting the Final Rent and Knowing When It’s Drifting
Your comp analysis gives you a range, not a single number. Picking the final rent inside that range depends on factors specific to your situation: how much vacancy risk you can absorb, the tenant quality you’re targeting, your unit’s actual condition versus your comps, and whether this is a one-off rental or part of a larger portfolio where consistency matters more than squeezing the last $50 out of one unit.
A few practical ways to test your number before locking it in:
- List at the top of your range for two weeks. If you get zero serious inquiries, drop toward the middle.
- Offer a small concession (half a week free, a reduced deposit) instead of lowering the sticker price, which protects your stated rent for future comps.
- Try a tiered offer: a higher rent paired with a shorter application window, which filters for tenants confident enough to move fast.
Once a tenant is in place, monitoring cadence matters as much as the initial number. Check comps weekly while a unit sits vacant, since market conditions can shift faster than you’d expect during an active search. For occupied, stable units, a quarterly check is usually enough to catch drift before your lease renewal conversation.
- Week 1 of vacancy: pull fresh comps and confirm your listed price still holds.
- Week 2 to 3: track listing views, inquiries, and application rate against your comp-based expectations.
- Week 4+: if activity is below what comparable listings are getting, reassess price before extending vacancy further.
- At each lease renewal: re-run the full comp process rather than defaulting to a flat percentage increase.
Vacancy costs compound quickly: a unit sitting empty for even two extra weeks while you hold out for top-of-range rent can erase months of the incremental gain you were chasing.
Turning Your Comp Set Into Underwriting Numbers
Once you have an adjusted market rent, the real work is feeding it into a full underwriting model rather than treating it as a standalone number. A rental property calculator needs several inputs beyond just rent: your adjusted market rent, a vacancy allowance (commonly 5% to 8% depending on your market), property management fees if applicable, a maintenance reserve, property taxes, insurance, and your financing terms.
Here’s how a comp set turns into a full cash flow picture:
- Start with your adjusted market rent from the comp workflow above, say $1,962 on the earlier two-bedroom example.
- Apply a vacancy allowance (5% here) to get effective gross income of roughly $1,864.
- Subtract a maintenance reserve, property management fee (if used), taxes, and insurance to arrive at net operating income.
- Factor in your mortgage payment to calculate monthly cash flow and debt service coverage ratio.
- Recalculate cap rate using your new NOI against the purchase price to see how the adjusted rent shifts your original assumptions.
A full underwriting model uses adjusted market rent alongside vacancy, management, maintenance, taxes, and insurance to calculate NOI and DSCR, which is a meaningfully different (and more accurate) output than a 1% rule pass/fail. Save every version of this calculation, including the comp set behind it, so you have a clear audit trail if a lender or appraiser asks how you arrived at your rent assumption.
Pro Tip: Export or screenshot your comp set and calculator output together. If your numbers ever get questioned during underwriting, having the source comps attached to the final cash flow model saves you from rebuilding your case from memory.
Real Estate Investor Toolkit’s Rental Property Calculator and Comps Analyzer exist specifically to formalize this handoff, turning a spreadsheet of adjusted comps into a saved, exportable underwriting record you can hand to a lender without redoing the math from scratch.
Speed Versus Rigor: When a Fast Estimate Is Fine and When It Isn’t
There’s a real tension in comp analysis between moving fast enough to compete for a deal and being thorough enough to trust the number once you own the property. Both instincts are correct, just at different stages.
Where investors get into trouble is treating that same quick pass as sufficient justification for an actual offer, a refinance appraisal, or a lender conversation. Those moments demand the full workflow: multiple sources, tight filters, dollar-based adjustments, and a documented confidence level.
The investors who consistently avoid rent-related surprises aren’t the ones who run the most sophisticated models. They’re the ones who know which stage of the deal they’re in and match their rigor to it. Screening a dozen properties in a weekend calls for speed. Signing a lender’s underwriting package calls for a paper trail. Confusing the two is where overestimated rent assumptions sneak into deals that looked great on a napkin and fell apart at closing.
Try the Free Calculators Behind This Comp Workflow
Running this entire process by hand in a spreadsheet works, but it’s slow, and it’s easy to lose track of which comps you adjusted and why three months later when a lender asks. Real Estate Investor Toolkit built its Comps Analyzer to handle the filtering, $/sqft normalization, and adjustment math this article just walked through, then save the whole comp set for later review.
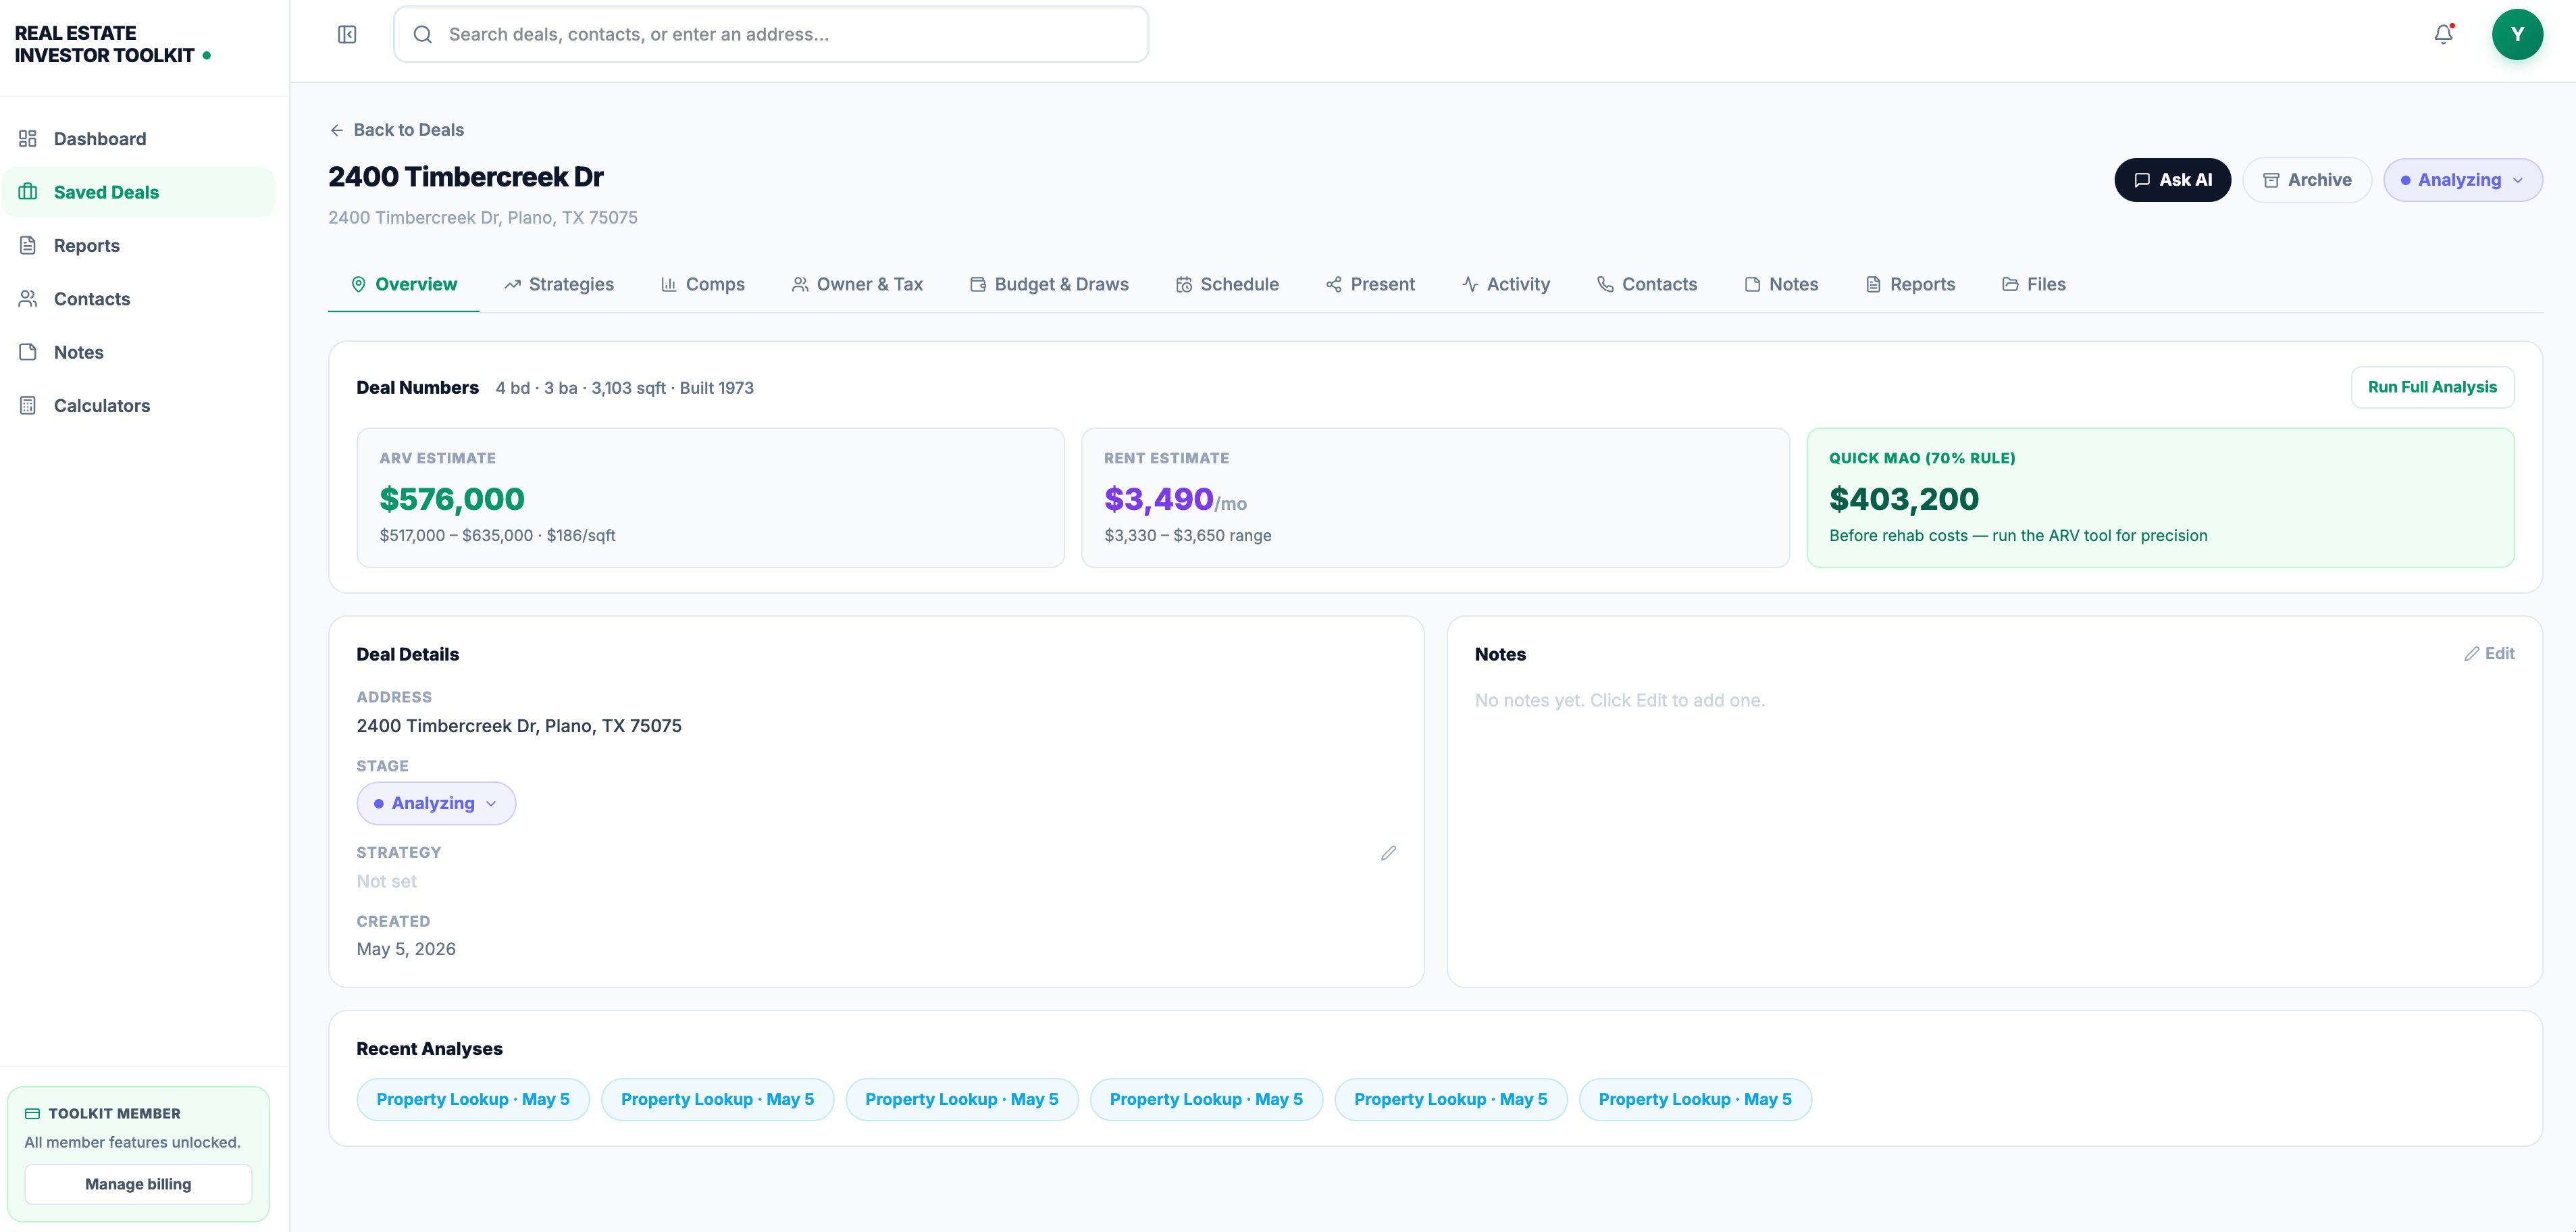
The free calculators cover the full chain from comp to cash flow: pull and adjust your comps, then run that adjusted rent straight through the Rental Property Calculator to get NOI, cap rate, and cash-on-cash figures without re-entering numbers by hand. No sign-up is required to try either tool, and a paid subscription unlocks saved comp audits, unlimited reports, and advanced property data if you’re running this process across more than one or two deals a month.
Start with a property you’re evaluating right now: pull your comps, adjust them, and save the report before you make an offer.
Frequently Asked Questions
How many rental comps do I need to analyze a property accurately? Five is the practical minimum. Below that, widen your distance or recency filters and explicitly note the added uncertainty rather than trusting a thin sample.
What’s the difference between asking rent and leased rent in comp analysis? Asking rent is what a listing advertises; leased rent is what a tenant actually signed for. Listings that sit active for weeks often signal the asking price is above what the market will bear.
Should I use the average or the median when analyzing rental comps? Use the median. One unusually high or low comp can distort an average, while the median stays stable against outliers.
How do I compare rental prices across units of different sizes? Convert each comp to a price per square foot rate, then apply that rate to your subject property’s exact square footage rather than comparing raw rent totals.
No.
How often should I re-check my rental comps once a tenant is in place? Check weekly while a unit is vacant and actively listed. For occupied, stable units, a quarterly review is usually enough to catch market drift before a lease renewal.
Sources
Save these alongside your comp audit; they’re useful for double-checking methodology or explaining your reasoning to a partner or lender.
- How to Pull and Analyze Rental Comps (Without Overestimating Rent) | REI Prime
- How to find rental comps | PropMetrics
- Rental Property ROI Calculator: Is This Deal Worth It? | CalcFi
- Rent Comparable Analysis (Rent Comps) — SyndicationPro
Recommended
- How to Analyze a Rental Property: Cash Flow, Cap Rate, and the 1% Rule — Real Estate Investing Guide | Real Estate Investor Toolkit
- How to Pull Real Estate Comps for Investment Properties — Real Estate Investing Guide | Real Estate Investor Toolkit
- Real Estate Comps Analyzer — Comparable Sales Tool | Real Estate Investor Toolkit